Application of Phase Rule to One Component System | Physical Chemistry PDF Download

Phase Rule for One - Component System
- The minimum number of phases in any system is one.
- According to the phase rule equation, a one-component system can have a maximum of two degrees of freedom.
- When C = 1 (number of components) and P = 1(number of phases), then:
- F = C - P = 1 - 1 = 2
- This means that a one-component system needs a maximum of two variables to be fully defined.
- The two variables are:
- Temperature
- Pressure
- Phase diagrams for one-component systems can be created by plotting Pressure vs. Temperature (P vs T).
- In a one-component system, the phase diagram includes:
- A point that represents a non-variant system.
- An area that indicates a bivariant system.
- A curve or line that shows a univariant system.
- Examples of one-component systems include the water system and the sulfur system.
Water System
Under normal conditions the system ‘water’ is a three-phase, one-component system. The three phases involved are liquid water, ice, water vapour. All these phases can be represented by one chemical entity H2O and hence one component of the system. The number of phases which can exist in equilibrium any time depends on the conditions of temperature and pressure. The phase diagram or PT-graph of the system/ water/ice/vapour is shown in Fig. 19.3. The salient features of the phase diagram are listed below.(1) The Curves OA, OB, OC
(2) The Triple Point O
(3) The Areas AOC, AOB, BOC
Let us proceed to discuss the significance of each of these features.
(1) The Curves OA, OB, OC
These three curves meet at the point O and divide the diagram into three regions or areas.
Curve OA, the Vapour Pressure curve of Water. It represents the vapour pressure of liquid water at different temperatures. The two phases water and water vapour coexist in equilibrium along this curve. The curve OA terminates at A, the critical point (218 atm, temp. 374ºC) when the liquid and vapour are indistinguishable from each other and there is left one phase only. When the vapour pressure is equal to one-atmosphere, the corresponding temperature, as indicated on the phase diagram is the boiling point (100ºC) of water.
Curve OB, the Sublimation curve of Ice. It shows the vapour pressure of solid ice at different temperatures. The two phases solid ice and vapour coexist in equilibrium along this curve. At the lower limit the curve OB terminates at absolute zero (– 273ºC) where no vapour exists.
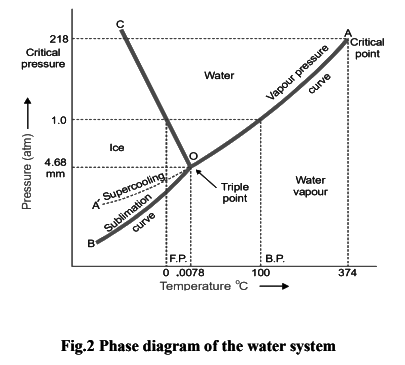
Curve OC, the Fusion curve of Ice. It depicts the effect of pressure on the melting point of ice. Here ice and water coexist in equilibrium. The fact that OC slopes to the left indicates that the melting point of ice decreases with increase of pressure. Since ice melts with decrease in volume by Le Chatelier’s principle the melting point is lowered by an increase of pressure. It may be noted that the 1.0 atmosphere line meets the fusion curve at 0ºC which is the normal melting point of ice.
Along the curves OA, OB, OC there are two phases in equilibrium and one component.
Therefore,
F = C – P + 2 = 1 – 2 + 2 = 1
Hence each two-phase system :
- water/water vapour represented by OA
- ice/water vapour represented by OB
- ice/water represented by OC
has one degree of freedom i.e., is monovariant.
(2) The Triple point ‘O’
The curves OA, OB and OC meet at the triple point ‘O’ where all the three phases liquid water/ ice/vapour are in equilibrium. This occurs at 0.0076ºC and vapour pressure 4.58 mm Hg. Since there are three phases and one component, we have
F = C– P + 2 = 1 – 3 + 2 = 0
i.e., the system at the triple point is nonvariant. Thus if either pressure or temperature is changed, the three phases would not exist and one of the phases would disappear.
(3) Area AOC, AOB, BOC
The areas or regions between the curves show the conditions of temperature and pressure under which a single phase–ice, water or vapour is capable of stable existence. Thus, Area AOC represents conditions for the one-phase system water.
- Area AOB represents conditions for the one-phase system water vapour.
- Area BOC represents conditions for the one-phase system ice.
- In all the three areas there being one-phase and one-component, we have F = C – P + 2 = 1 – 1 + 2 = 2
Thus each system water, water vapour, or ice has 2 degrees of freedom i.e., the system is bivariant.
(4) Metastable system : Supercooled Water/Vapour System
The vapour pressure curve of water AO can be continued past the triple point as shown by the dashed line OA'. That is, water can be supercooled by carefully eliminating solid particles. The supercooled water/vapour system is metastable (unstable). It at once reverts to the stable system ice/vapour on the slightest disturbance or introducing a crystal of ice.
Sulphur system
It is a one-component, four-phase system. The four phases are :(a) Two solid polymorphic forms :
- Rhombic Sulphur (SR)
- Monoclinic Sulphur (SM)
(b) Sulphur Liquid (SL)
(c) Sulphur Vapour (SV)
All the four phase can be represented by the only chemical individual ‘sulphur’ itself and hence one component of the system.
The two crystalline forms of sulphur SR and SM exhibit enantiotropy with a transition point at 95.6ºC. Below this temperature SR is stable, while above it SM is the stable variety. At 95.6ºC each form can be gradually transformed to the other and the two are in equilibrium. At 120ºC, SM melts.
Thus, 95.61º 120º
SR ↔ SM ↔ SL
The phase diagram for the sulphur system is shown in Fig. 19.4. The salient features of the phase diagram are described below.
(i) The six curves AB, BC, CD, BE, CE, EG
(ii) The three Triple points B, C, E
(iii) The four areas :
- ABG marked ‘solid Rhombic’
- BEC marked ‘solid Monoclinic’
- GECD marked ‘liquid Sulphur’
- ABCD marked ‘Sulphur vapour’
(1) The curves AB, BC, CD, BE, CE, EG
These six curves divide the diagram into four areas.
Curve AB, the Vapour Pressure curve of SR. It shows the vapour pressure of solid rhombic sulphur (SR) at different temperatures. Along this curve the two phases SR and sulphur vapour (SV) are in equilibrium.
The system SR/SV has one degree of freedom,
F = C – P + 2 = 1 – 2 + 2 = 1
i.e., it is monovariant.
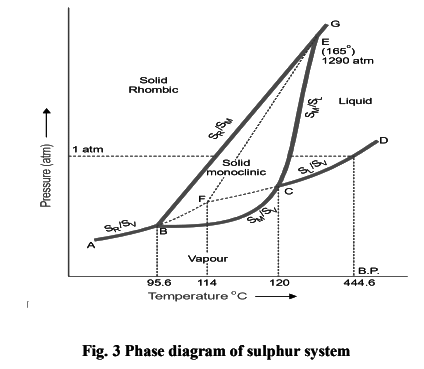
Curve BC, the Vapour Pressure curve of SM. It shows variation of the vapour pressure of monoclinic sulphur (SM) with temperature. SM and SV coexist in equilibrium along this curve. The system SM/SV is monovariant.
Curve CD, the Vapour Pressure curve of SL. It depicts the variation of the vapour pressure of liquid sulphur (SL) with temperature. SL and SV are in equilibrium along CD. The two phase system SL/SV is monovariant. One atmosphere line meets this curve at a temperature (444.6ºC) which is the boiling point of sulphur.
Curve BE, the Transition curve. It shows the effect of pressure on the transition temperature for SR and SM. As two solid phases are in equilibrium along the curve, the system SR/SM is monovariant. The transformation of SR and SM is accompanied by increase of volume (density of SR = 2.04; SM = 1.9) and absorption of heat i.e.,
SR + Q (heat energy) ↔ SM
Thus the increase of pressure will shift the equilibrium to the left (Le Chatelier’s Principle) and the transition temperature will, therefore, be raised. This is why the line BE slopes away from the pressure axis showing thereby that the transition temperature is raised with increase of pressure
Curve CE, the Fusion curve of SM. It represents the effect of pressure on the melting point of SM. The two phases in equilibrium along this curve are SM and SL. The system SM/SL is monovariant. As the melting or fusion of SM is accompanied by a slight increase of volume, the melting point will rise by increase of pressure (Le Chatelier’s principle). Thus the curve CE slopes slightly away from the pressure axis. The curve ends at E because SM ceases to exist beyond this point.
Curve EG, the Fusion curve for SR. Here the two phases in equilibrium are SR and SL. The number of phases being two, the system SR/SL is monovariant.
(2) The Triple points B, C, E
Triple point B. This is the meeting point of the three curves AB, BC and BE. Three phases, solid SR, solid SM and SV are in equilibrium at the point B. There being three phases and one component, the system SR/SM/SL is nonvariant.
F = C – P + 2 = 1 – 3 + 2 = 0
At B, SR is changed to SM and the process is reversible. Thus the temperature corresponding to B is the transition temperature (95.6ºC).
Triple point C. The curves BC, CD, CE meet at this point. The three phases in equilibrium are SM, SL and SV. There being three phases and one component, the system SM/SL/SV is nonvariant. The temperature corresponding to C as indicated on the phase diagram is 120ºC. This is the melting point of SM.
Triple point E. The two lines CE and BE, having different inclinations away from the pressure axis, meet at E where a third line EG also joins. The three phases SR, SM and SL are in equilibrium and the system at the point E is nonvariant. This point gives the conditions of existence of the system SR /SM /SL at 155ºC and 1290 atmospheres pressure.
(3) The Areas
The phase diagram of the sulphur system has four areas or regions. These are labelled as rhombic sulphur, monoclinic sulphur, liquid sulphur and vapour. These represent single phase systems which have two degrees of freedom,
F = C – P + 2 = 1 – 1 + 2 = 2
That is, each of the systems SR, SM, SL, and SV are bivariant.
(4) Metastable Equilibria
The change of SR to SM takes place very slowly. If enough time for the change is not allowed and SR is heated rapidly, it is possible to pass well above the transition point without getting SM. In that case, there being three phases (SR, SL, SV) only and one component, the phase diagram, like that of water system, will consist of three curves, one triple point and three areas.
|
90 videos|144 docs|67 tests
|
FAQs on Application of Phase Rule to One Component System - Physical Chemistry
| 1. What is the Phase Rule and how does it apply to one component systems? |  |
| 2. What are the degrees of freedom in a one component system with two phases? | |
| 3. Can you provide an example of a one component system and its phases? | |
| 4. What happens to the degrees of freedom in a one component system at the triple point? | |
| 5. How does the Phase Rule help in understanding phase diagrams of one component systems? | |


ppt
,Important questions
,practice quizzes
,Viva Questions
,Application of Phase Rule to One Component System | Physical Chemistry
,MCQs
,Extra Questions
,study material
,Objective type Questions
,mock tests for examination
,video lectures
,Previous Year Questions with Solutions
,Application of Phase Rule to One Component System | Physical Chemistry
,Summary
,Semester Notes
,shortcuts and tricks
,past year papers
,Application of Phase Rule to One Component System | Physical Chemistry
,Sample Paper
,Exam
,Free
;


Application of Phase Rule to One Component System Free PDF Download
Importance of Application of Phase Rule to One Component System
Application of Phase Rule to One Component System Notes
Application of Phase Rule to One Component System Chemistry Questions
Study Application of Phase Rule to One Component System on the App
|
© EduRev
|
Education Revolution
|


|


within 7 days!