Chapter 25 - Data Handling-III (Part - 2), Class 8, Maths RD Sharma Solutions | RD Sharma Solutions for Class 8 Mathematics PDF Download
PAGE NO 25.13:
Question 12:
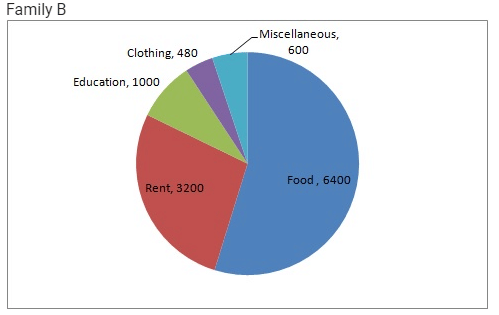
Represent the following data by a pie-diagram:
| Items of expenditure | Expenditure | |
| Family A | Family B | |
| Food | 4000 | 6400 |
| Clothing | 2500 | 480 |
| Rent | 1500 | 3200 |
| Education | 400 | 1000 |
| Miscellaneous | 1600 | 600 |
| Total | 10000 | 16000 |
Ans.
We know:
Central angle of a component = (component value/sum of component values × 360)
Here the total expenditure of family A = 10000 and family B = 11680
Thus the central angle for each component can be calculated as follows:
| Item | Expenditure (Family A) | Sector angle (Family A) | Expenditure (Family B) | Sector angle (Family B) |
| Food | 4000 | 4000/10000 × 360 = 144 | 6400 | 6400/11680 × 360 = 197.3 |
| Clothing | 2500 | 2500/10000 × 360 = 90 | 480 | 480/11680 × 360 = 14.8 |
| Rent | 1500 | 1500/10000 × 360 = 54 | 3200 | 3200/11680 × 360 = 98.6 |
| Education | 400 | 400/10000 × 360 = 14.4 | 1000 | 1000/11680 × 360 = 30.8 |
| Miscellaneous | 1600 | 1600/10000 × 360 = 57.6 | 600 | 600/11680 × 360 = 18.5 |
Total expenditure of family A: 10000
Total expenditure of family B: 11680 (not 16000)
Now, the pie chat representing the given data can be constructed by following the steps below:
Step 1 : Draw circle of an appropriate radius.
Step 2 : Draw a vertical radius of the circle drawn in step 1.
Step 3 : Choose the largest central angle. Here the largest central angle is 144o. Draw a sector with the central angle 144o in such a way that one of its radii coincides with the radius drawn in step 2 and another radius is in its counter clockwise direction.
Step 4 : Construct other sectors representing the other items in the clockwise sense in descending order of magnitudes of their central angles.
Step 5 : Shade the sectors with different colours and label them, as shown as in figure below.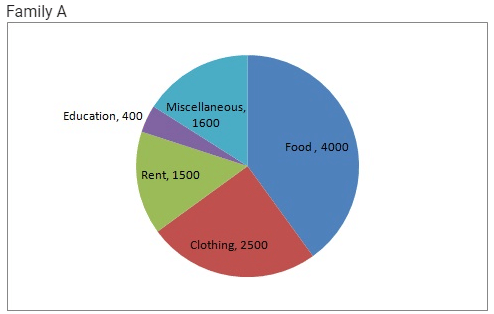
Question 13:
Following data gives the break up of the cost of production of a book:
| Printing | Paper | Binding charges | Advertisement | Royalty | Miscellaneous |
| 30% | 15% | 15% | 20% | 10% | 15% |
Draw a pie- diagram depicting the above information.
Ans.
We know:
Central angle of a component = (component value/sum of component values × 360)
Here, total expenditures = 105%
Thus, the central angle for each component can be calculated as follows:
| Item | Expenditure (in %) | Sector angle |
| Printing | 30 | 30/105 × 360 = 102.9 |
| Paper | 15 | 15/105 × 360 = 51.4 |
| Binding charges | 15 | 15/105 × 360 = 51.4 |
| Advertisement | 20 | 20/105 × 360 = 68.6 |
| Royalty | 10 | 10/105 × 360 = 34.3 |
| Miscellaneous | 15 | 15/105 × 360 = 51.4 |
Total : 105%
Now, the pie chat representing the given data can be constructed by following the steps below:
Step 1 : Draw circle of an appropriate radius.
Step 2 : Draw a vertical radius of the circle drawn in step 1.
Step 3 : Choose the largest central angle. Here the largest central angle is 102.9o. Draw a sector with the central angle 102.9o in such a way that one of its radii coincides with the radius drawn in step 2 and another radius is in its counter clockwise direction.
Step 4 : Construct other sectors representing the other items in the clockwise sense in descending order of magnitudes of their central angles.
Step 5 : Shade the sectors with different colours and label them, as shown as in figure below.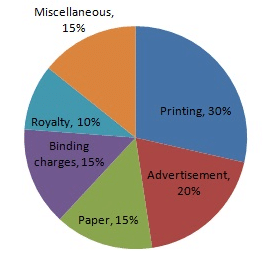
Question 14:
Represent the following data with the help of a pie-diagram:
| Items | Wheat | Rice | Tea |
| Production (in metric tons) | 3260 | 1840 | 900 |
Ans.
We know:
Central angle of a component = (component value/sum of component values x 360)
Here, total production = 6000 (in metric tons)
Thus, the central angle for each component can be calculated as follows:
| Item | Production (in metric tons) | Sector angle |
| Wheat | 3260 | 3260/6000 x 360 = 195.6 |
| Rice | 1840 | 1840/6000 x 360 = 1 10.4 |
| Tea | 900 | 900/6000 x 360 = 54 |
Total = 6000 (in metric tons)
Now, the pie chat representing the given data can be constructed by following the steps below:
Step 1 : Draw circle of an appropriate radius.
Step 2 : Draw a vertical radius of the circle drawn in step 1.
Step 3 : Choose the largest central angle. Here, the largest central angle is 195.6o. Draw a sector with the central angle 195.6 o in such a way that one of its radii coincides with the radius drawn in step 2 and another radius is in its counter clockwise direction.
Step 4 : Construct the other sectors representing the other items in the clockwise direction in descending order of magnitudes of their central angles.
Step 5 : Shade the sectors with different colours and label them as shown in the figure below.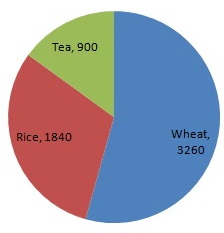
PAGE NO 25.14:
Question 15:
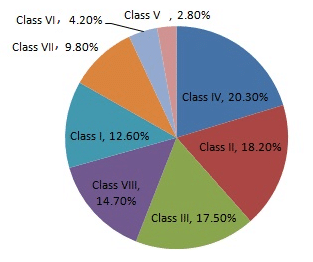
Draw a pie-diagram representing the relative frequencies (expressed as percentage) of the eight classes as given below:
12.6, 18.2, 17.5, 20.3, 2.8, 4.2, 9.8, 14.7
Ans.
We know:
Central angle of a component = (component value/sum of component values × 360)
Here, total amount = 100.1%
Thus, central angle for each component can be calculated as follows:
| Item | Amount (in %) | Sector angle |
| Class I | 12.6 | 12.6/100.1 × 360 = 45.3 |
| Class II | 18.2 | 18.2/100.1 × 360 = 65.5 |
| Class III | 17.5 | 17.5/100.1 × 360 = 62.9 |
| Class IV | 20.3 | 20.3/100.1 × 360 = 73 |
| Class V | 2.8 | 2.8/100.1 × 360 = 10.1 |
| Class VI | 4.2 | 4.2/100.1 × 360 = 15.1 |
| Class VII | 9.8 | 9.8/100.1 × 360 = 35.2 |
| Class VIII | 14.7 | 14.7/100.1 × 360 = 52.9 |
Total = 100.1%
Now, the pie chat representing the given data can be constructed by following the steps below:
Step 1 : Draw circle of an appropriate radius.
Step 2 : Draw a vertical radius of the circle drawn in step 1
Step 3 : Choose the largest central angle. Here the largest central angle is 73o. Draw a sector with the central angle 73o in such a way that one of its radii coincides with the radius drawn in step 2 and another radius is in its counter clockwise direction.
Step 4 : Construct other sectors representing the other items in the clockwise sense in descending order of magnitudes of their central angles.
Step 5 : Shade the sectors with different colours and label them, as shown as in the figure below.
Question 16:
Following is the break up of the expenditure of a family on different items of consumption:
| Items | Food | Clothing | Rent | Education | Fuel etc. | Medicine | Miscellaneous |
| Expenditure (in Rs) | 1600 | 200 | 600 | 150 | 100 | 80 | 270 |
Draw a pie-diagram to represent the above data.
Ans.
We know:
Central angle of a component = (component value/sum of component values × 360)
Here, total expenditure = Rs 3000
Thus, central angle for each component can be calculated as follows:
| Item | Expenditure (in Rs) | Sector angle |
| Food | 1600 | 1600/3000 × 360 = 192 |
| Clothing | 200 | 200/3000 × 360 = 24 |
| Rent | 600 | 600/3000 × 360 = 72 |
| Education | 150 | 150/3000 × 360 = 18 |
| Fuel etc | 100 | 100/3000 × 360 = 12 |
| Medicine | 80 | 80/3000 × 360 = 9.6 |
| Miscellaneous | 270 | 270/3000 × 360 = 32.4 |
Total : 3000 (in Rs)
Now, the pie chat representing the given data can be constructed by following the steps below:
Step 1 : Draw a circle of an appropriate radius.
Step 2 : Draw a vertical radius of the circle drawn in step 1.
Step 3 : Choose the largest central angle. Here, the largest central angle is 192o. Draw a sector with the central angle 192o in such a way that one of its radii coincides with the radius drawn in step 2 and another radius is in its counter clockwise direction.
Step 4 : Construct other sectors representing the other items in the clockwise sense in descending order of magnitudes of their central angles.
Step 5 : Shade the sectors with different colours and label them as shown in the figure below.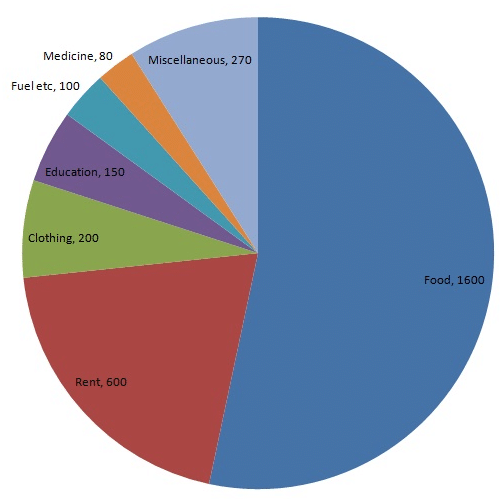
Question 17:
Draw a pie-diagram for the following data of the investment pattern in a five year plan:
| Agriculture | Irrigation and Power | Small Industries | Transport | Social service | Miscellaneous |
| 14% | 16% | 29% | 17% | 16% | 8% |
Ans.
We know:
Central angle of a component = (component value/sum of component values x 360)
Here the total percentage = 100%
Thus, the central angle for each component can be calculated as follows:
| Item | Amount (in %) | Sector angle |
| Agriculture | 14 | 14/100 x 360 = 50.4 |
| Irrigation and Power | 16 | 16/100 x 360 = 57.6 |
| Small Industries | 29 | 29/100 x 360 = 104.4 |
| Transport | 17 | 17/100 x 360 = 61.2 |
| Social Service | 16 | 16/100 x 360 = 57.6 |
| Miscellaneous | 8 | 8/100 x 360 = 28.8 |
Now, the pie chat representing the given data can be constructed by following the steps below:
Step 1 : Draw circle of an appropriate radius.
Step 2 : Draw a vertical radius of the circle drawn in step 1.
Step 3 : Choose the largest central angle. Here the largest central angle is 104.4o. Draw a sector with the central angle 104.4o in such a way that one of its radii coincides with the radius drawn in step 2 and another radius is in its counter clockwise direction.
Step 4 : Construct the other sectors representing the other items in the clockwise sense in descending order of magnitudes of their central angles.
Step 5 : Shade the sectors with different colours and label them as shown in the figure below.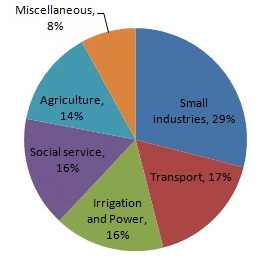
PAGE NO 25.21:
Question 1:
The pie-chart given in Fig. 25.17 represents the expenditure on different items in constructing a flat in Delhi. If the expenditure incurred on cement is Rs 112500, find the following: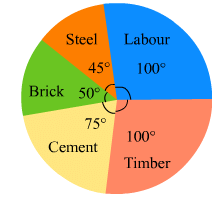
(i) Total cost of the flat.
(ii) Expenditure incurred on labour.
Ans.
(i) Expenditure incurred on cement = 
Total cost of the flat =  = Rs 540000
(ii) Expenditure incurred on labour = 
 = Rs 150000
Question 2:
The pie-chart given in Fig. 25.18 shows the annual agricultural production of an Indian state. If the total production of all the commodities is 81000 tonnes, find the production (in tonnes) of
(i) Wheat
(ii) Sugar
(iii) Rice
(iv) Maize
(v) Gram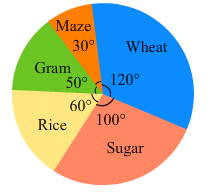
Ans.
(i)
Production of wheat = 
 = 27000 tonnes
(ii)
Production of sugar = 
 = 22500 tonnes
(iii)
Production of rice = 
 = 13500 tonnes
(iv)
Production of maize = 
 = 6750 tonnes
(v)
Production of gram = 
 = 11250 tonnes
PAGE NO 25.22:
Question 3:
The following pie-chart shows the number of students admitted in different faculties of a college. If 1000 students are admitted in Science answer the following: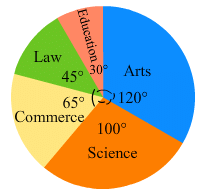
(i) What is the total number of students?
(ii) What is the ratio of students in science and arts?
Ans.
(i) Students in science =  1000 =
∴ Total students = 3600
(ii) Students in arts = 

∴ Ratio of students in science and arts = 1000:1200 = 5:6
Question 4:
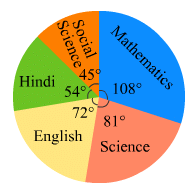
In Fig. 25.20, the pie-chart shows the marks obtained by a student in an examination. If the student secures 440 marks in all, calculate his marks in each of the given subjects.
Ans.
Marks secured in mathematics = (108 x 440)/360 marks = 132 marks
Marks secured in science = (81 x 440)/360 marks = 99 marks
Marks secured in English = (72 x 440)/360 marks = 88 marks
Marks secured in Hindi = (54 x 440)/360 marks = 66 marks
Marks secured in social science = (45 x 440)/360 marks = 55 marks
Question 5:
In Fig. 25.21, the pie-chart shows the marks obtained by a student in various subjects. If the student scored 135 marks in mathematics, find the total marks in all the subjects. Also, find his score in individual subjects.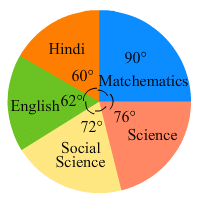
Ans.
Marks scored in mathematics =  135 =
135 = 
Total Marks = 540
Marks scored in Hindi = (Central angle of Hindi x Total)/360
= (60 x 540)/360 marks = 90 marks
Similarly, marks scored in science = (76 x 540) /360 marks = 114 marks
Marks scored in social science = (72 x 540) /360 marks = 108 marks
Marks scored in English = (62 x 540)/360 marks = 93 marks
PAGE NO 25.23:
Question 6:
The following pie-chart shows the monthly expenditure of Shikha on various items. If she spends Rs 16000 per month, answer the following questions: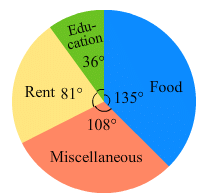
(i) How much does she spend on rent?
(ii) How much does she spend on education?
(iii) What is the ratio of expenses on food and rent?
Ans.
(i) Money spent on rent = 
 = Rs 3,600
(ii) Money spent on education = 
 = Rs 1,600
(iii) Money spent on food = 
 = 6,000
Ratio of expenses on food and rent = 6000/3600 = 5/3
Question 7:
The pie chart (as shown in the figure 25.23) represents the amount spent on different sports by a sports club in a year. If the total money spent by the club on sports is Rs 1,08,000, find the amount spent on each sport.
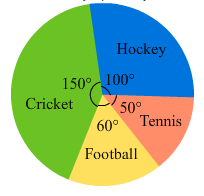
Ans.
Amount spent on cricket =  =
=  = Rs 45,000
Amount spent on hockey =  =
=  = Rs 30,000
Amount spent on football =  =
=  = Rs 18,000
Amount spent on tennis =  =
=  = Rs 15,000
FAQs on Chapter 25 - Data Handling-III (Part - 2), Class 8, Maths RD Sharma Solutions - RD Sharma Solutions for Class 8 Mathematics
| 1. What is the importance of data handling in mathematics? |  |
| 2. How can data handling be applied in real-life situations? |  |
| 3. What are the different methods of data collection? |  |
| 4. What are the measures of central tendency? |  |
| 5. How can outliers affect data analysis? |  |


