The above analysis of market equilibrium was done by us under the ceteris paribus assumption. The facts of the real world, however, are such that the determinants of demand other than price of the commodity under consideration (like income, tastes and preferences, population, technology, prices of factors of production etc.) always change causing shifts in demand and supply. Such shifts affect equilibrium price and quantity. The four possible changes in demand and supply are:
(i) An increase (shift to the right) in demand;
(ii) A decrease (shift to the left) in demand;
(iii) An increase (shift to the right) in supply;
(iv) A decrease (shift to the left) in supply.
We will consider each of the above changes one by one.
(i) An increase in demand: In figure 8, the original demand curve of a normal good is DD and supply curve is SS. At equilibrium price OP, demand and supply are equal to OQ.
Now suppose the money income of the consumer increases and the demand curve shifts to D1D1 and the supply curve remains the same. We will see that on the new demand curve D1 D1 at OP price, demand increases to OQ2 while supply remains the same i.e. OQ and there is excess demand in the market equal to Q Q2 . Since supply is short of demand, price will go up to OP1 . With the higher price, supply will also shoot up generating an increase in the quantity supplied or an upward movement along the supply curve. Ultimately, a new equilibrium between demand and supply will be reached. At this equilibrium point, OP1 is the price and OQ1 is the quantity which is demanded and supplied.
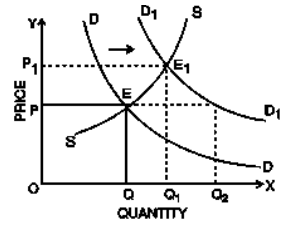
Fig. 8: Increase in Demand, causing an increase in equilibrium price and quantity
Thus, we see that, with an increase in demand, there is an increase in equilibrium price, as a result of which the quantity supplied rises. As such, the quantity sold and purchased also increases.
(ii) Decrease in Demand: The opposite will happen when demand falls as a result of a fall in income, while the supply remains the same. The demand curve will shift to the left and become D1D1 while the supply curve remains as it is. With the new demand curve D1D1, at original price OP, OQ2 is demanded and OQ is supplied. As the supply exceeds demand, price will come down and quantity demanded will go up. A new equilibrium price OP1 will be settled in the market where demand OQ1 will be equal to supply OQ1.
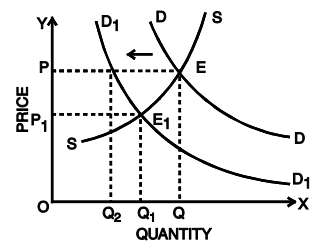
Fig. 9: Decrease in Demand Resulting in a Decrease in Price and Quantity Demanded
Thus, with a decrease in demand, there is a decrease in the equilibrium price and quantity demanded and supplied.
(iii) Increase in Supply: Let us now assume that demand does not change, but there is an increase in supply say, because of improved technology.
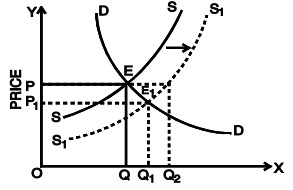
Fig. 10: Increase in Supply, Resulting In Decrease in Equilibrium Price and Increase in Quantity Supplied
The supply curve SS will shift to the right and become S1 S1 . At the original equilibrium price OP, OQ is demanded and OQ2 is supplied (with new supply curve). At the original price, a surplus now exists; as a result, the equilibrium price falls and the quantity demanded rises. A new equilibrium price OP1 will be settled in the market where demand OQ1 will be equal to supply OQ1 . Thus, as a result of an increase in supply with demand remaining the same, the equilibrium price will go down and the quantity demanded will go up.
(iv) Decrease in Supply: If because of some reason, there is a decrease in supply we will find that equilibrium price will go up, but the amount sold and purchased will go down as shown in figure 11.
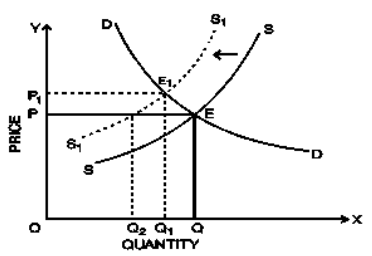
Fig.11: Decrease in Supply Causing an Increase in the Equilibrium Price and a fall in Quantity Demanded
Simultaneous Changes in Demand and Supply
Till now, we were considering the effect of a change either in demand or in supply on the equilibrium price and quantity sold and purchased. It sometimes happens that events shift both the demand and supply curves at the same time. This is not unusual; in real life, supply curves and demand curves for many goods and services typically shift quite often because of continuous change in economic environment. During a war, for example, shortage of goods will often lead to decrease in their supply while full employment causes high total wage payments which increase demand.
What happens when the demand and supply curves shift in the same direction? We may discuss the effect on equilibrium price and quantity when both demand and supply increase simultaneously with the help of the diagrams below:
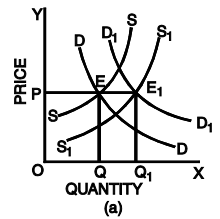
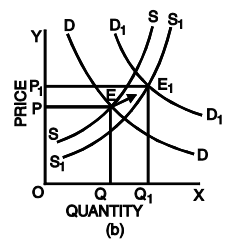
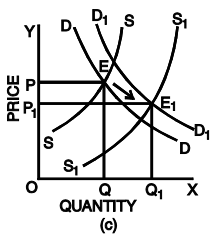
Fig.12: Simultaneous Change in Demand and Supply
Fig. 12 shows simultaneous change in demand and supply and its effects on the equilibrium price. In the figure, the original demand curve DD and the supply curve SS meet at E at which OP is the equilibrium price and OQ is the quantity bought and sold.
Fig. 12(a) shows that increase in demand is equal to increase in supply. The new demand curve D1 D1 and S1 S1 meet at E1 . The new equilibrium price is equal to the old equilibrium price (OP). However, equilibrium quantity is more.
Fig. 12(b) shows that increase in demand is more than increase in supply. Hence, the new equilibrium price OP1 is higher than the old equilibrium price OP. The opposite will happen i.e. the equilibrium price will go down if there is a simultaneous fall in demand and supply and the fall in demand is more than the fall in supply.
Fig. 12(c) shows that supply increases in a greater proportion than demand. The new equilibrium price will be less than the original equilibrium price. Conversely, if the fall in the supply is more than proportionate to the fall in the demand, the equilibrium price will go up.
What is the effect on equilibrium price and quantity when both demand and supply decrease? You can check it yourselves with the help of diagrams.
We can summarise the two possible outcomes when the supply and demand curves shift in the same direction as follows:
- When both demand and supply increase, the equilibrium quantity increases but the change in equilibrium price is uncertain.
- When both demand and supply decrease, the equilibrium quantity decreases but the change in equilibrium price is uncertain.
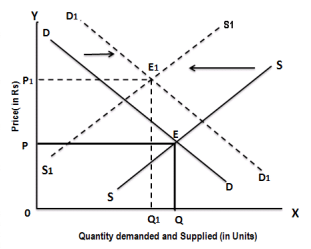
What happens when the demand and supply curves shift in opposite direction? We may discuss the effect on equilibrium price and quantity when demand and supply curves shift in opposite direction with the help of the diagrams below:
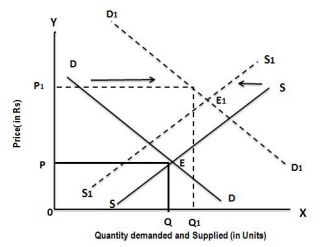
(a)
(b)
Fig 13: Effect on Equilibrium Price and Quantity When Demand and Supply Curves Shift in Opposite Directions
In panel (a) there is a simultaneous rightward shift of the demand curve and leftward shift of the supply curve. Here, the increase in demand is more than the decrease in supply, therefore, the equilibrium price and equilibrium quantity will rise. In panel (b) there is also a coincident rightward shift of the demand curve and leftward shift of the supply curve. Here, the decrease in supply is more than the increase in demand, consequently, the equilibrium price rises and the equilibrium quantity falls. In both cases, the equilibrium price rises from P to P1 as the equilibrium moves from E to E1 . What is the effect on quantity? In panel (a), the increase in demand is large relative to the decrease in supply and the equilibrium quantity rises as a result. In panel (b), the decrease in supply is large relative to the increase in demand, and the equilibrium quantity falls as a result. That is, when demand increases and supply decreases, the actual quantity bought and sold can go either way, depending on how much the demand and supply curves have shifted.
In general, when supply and demand shift in opposite directions, we cannot predict what the ultimate effect will be on the quantity bought and sold. What we can say is that a curve that shifts a disproportionately greater distance than the other curve will have a disproportionately greater effect on the quantity bought and sold.
We can summarise the two possible outcomes when the supply and demand curves shift in the opposite directions as follows:
- When demand increases and supply decreases, the equilibrium price rises but nothing certain can be said about the change in equilibrium quantity.
- When demand decreases and supply increases, the equilibrium price falls but nothing certain can be said about the change in equilibrium quantity
ILLUSTRATION:
D1 and S1 are the original demand and supply curves. D2 , D3 , S2 and S3 are possible new demand and supply curves. Starting from initial equilibrium point (1), what point on the graph is most likely to result from each change given in Questions 1 to 4?
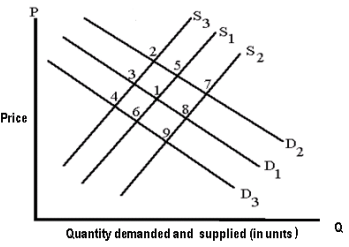
- Assume X is a normal good. Holding everything else constant, assume that income rises and the price of a factor of production also increases. What point in the figure above is most likely to be the new equilibrium price and quantity?
- We are analyzing the market for good Z. The price of a complement good, good Y, declines. At the same time, there is technological advance in the production of good Z. What point the figure above is most likely to be the new equilibrium price and quantity?
- Heavy rains in Maharashatra during 2005 and 2006 caused havoc with the rice crop. What point in the figure above is most likely to be the new equilibrium price and quantity?
- Assume that consumers expect the prices of new cars to significantly increase next year. What point in the figure above is most likely to be the new equilibrium price and quantity?
SUMMARY- Prices of goods express their exchange value.
- In an open competitive market, it is the interaction between demand and supply that tends to determine equilibrium price and quantity.
- Equilibrium price or market clearing price is the price at which the quantity demanded of a commodity equals the quantity supplied of the commodity there is no unsold stock or no unsupplied demand.
- Equilibrium is said to be stable if any disturbance to it is self adjusting so that the original equilibrium is restored automatically, through the fundamental working of the market. Price movements eliminate shortage or surplus.
- If demand increases without any corresponding increase in supply, there will be increase in equilibrium price, as a result of which the quantity sold and purchased also increases.
- If demand decreases without any change in supply, there will be decrease in the equilibrium price and quantity demanded and supplied.
- If there is an increase in supply without any change in demand, the equilibrium price will go down and the quantity demanded will go up.
- If there is a decrease in supply without any change in demand, the equilibrium price will go up but the amount sold and purchased will go down.
- There can be simultaneous changes in both demand and supply and the equilibrium price will change according to the proportionate change in demand and supply.
- When both demand and supply increase, the equilibrium quantity increases but the change in equilibrium price is uncertain.
- When both demand and supply decrease, the equilibrium quantity decreases but the change in equilibrium price is uncertain.
- When demand increases and supply decreases, the equilibrium price rises but nothing certain can be said about the change in equilibrium quantity.
- When demand decreases and supply increases, the equilibrium price falls but nothing certain can be said about the change in equilibrium quantity.
|


