Formative Assessment - Data Handling

Question 1: Complete the following crossword puzzle using the given directions for ACROSS [from left to right] and DOWN [from top to bottom].
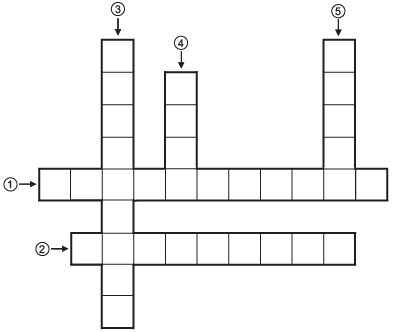
Directions:
Accross: (1) __________ is the measure of the chance of the happening of an event.
(2) is the number of times a particular entry occurs. __________.
Down:
(3) __________ is a special type of bargraph in which the rectangles are having no gap between them.
(4) The numerical information is called __________.
(5) The probability of a sure __________ is 1.
Question 2: Match the following:
Column A | Column B |
(a) Probability of a sure event | (i) 0 |
(b) Probability of an impossible event. | (ii) no |
(c) In a histogram there is ______ gap between the bars. | (iii) 1 |
(d) In a bar graph there is _________ gap between the bars. | (iv) equal |
Question 3: Choose the appropriate answer:
(i) A coin tossed once; what is the probability of getting a head?
(a) 1
(b) 2
(c) 1/2
(d) 0
(ii) In the interval (0-10), 10 is called the
(a) Lower limit
(b) upper limit
(c) range
(d) frequency
(iii) Tally marks are used to represent:
(a) Lower limits
(b) upper limits
(c) range
(d) frequency
(iv) The mid-value of the class interval is called class mark and it is equal to:
(a) 
(b) 
(c) 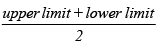
(d) 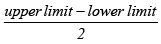
Question 4: Answer the following questions:
(i) A die has six faces having dots, 1, 2, 3, 4, 5 and 6 respectively.
What is the sum of dots on two faces of a die ?
(ii) A die is thrown once. What is the probability of getting a prime-number?
(iii) What is the class size in the adjoining histogram?
(iv) What do we call a circle-graph?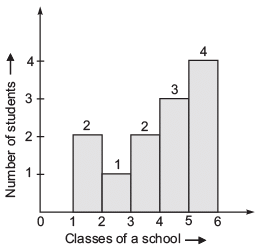
ANSWERS
1. (1) → PROBABILITY
(2) → FREQUENCY
(3) → HISTOGRAM
(4) → DATA
(5) → EVENT
2. (a) → (iii)
(b) → (i)
(c) → (ii)
(d) → (iv)
3. (i) (c)
(ii) (b)
(iii) (d)
(iv) (c)
4. (i) 7
(ii) 1/2
(iii) 1
(iv) → piechart
FAQs on Formative Assessment - Data Handling
| 1. What is the importance of formative assessment in data handling? |  |
| 2. How can teachers effectively implement formative assessments in data handling lessons? | |
| 3. What types of data handling skills can be assessed through formative assessments? | |
| 4. How can students benefit from formative assessments in their learning of data handling? | |
| 5. What are some challenges educators may face when using formative assessments in data handling? | |


