
Best Study Material for Class 8 Exam
Class 8 Exam > Class 8 Notes > Mathematics (Maths) Class 8 > Worksheet Questions - Data Handling
Class 8 Maths - Data Handling CBSE Worksheets
Worksheet Questions (Part - 1)
1. Read the following bar-graph and answer the following questions.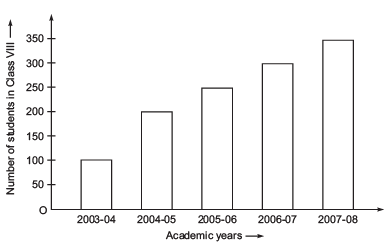
(i) What is the information given by the bar graph?
(ii) In which year is the increase in the number of students is maximum?
(iii) In which year is the number of students maximum?
(iv) Is the number of students during 2005-06 twice that of 2003-04?
2. Read the following bar graph and answer the following questions.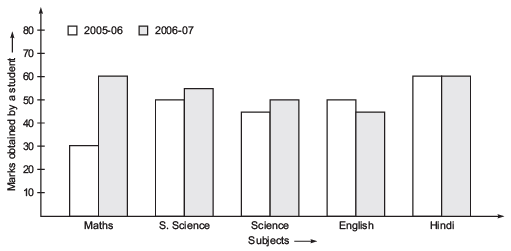
(i) What is the information given by the double bar graph?
(ii) In which subject has the performance improved the most?
(iii) In which subject the performance deteriorated?
(iv) In which subject is the performance at par?
3. A group of students was asked for their favorite subject. The results were listed as under:
| Art, Mathematics, Science, English, Mathematics, Art, English, Mathematics, English, Art, Science, Art, Science, Science, Mathematics, Art, English, Art, Science, Mathematics, Science, Art. |
Answer the following questions:
(i) Which is the most liked subject?
(ii) Which is the least liked subject?
4. Read the following histogram and answer the questions given below: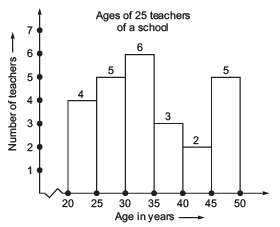
(i) How many teachers are of age 45 years or more but less than 50 years?
(ii) How many teachers are of age less than 35 years?
ANSWERS
1. (i) Number of students in class VIII in different academic years.
(ii) 2004-05
(iii) 2007-08
(iv) No
2. (i) Marks obtained by a student in different subjects by a student in 2005-06 and 2006-07.
(ii) Mathematics
(iii) English
(iv) Hindi
3. (i) Science
(ii) English
4. (i) 5 teachers
(ii) 4 + 5 + 6 = 15 teachers
Worksheet Questions (Part - 2)
1. Read the following circle graphs and answer the questions given below:
(a) The time spent by a child during a day:
(i) On which activity maximum number of hours are spent?
(ii) On which two activities does he spend equal number of hours?
(iii) Find the central angles for each sector of activities.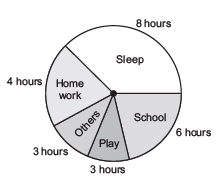
(b) Age group of people in a town:
(i) In which age group are the maximum number of people?
(ii) How many people are there is the ‘0-14 years’ group?
(iii) Find the central angle of the sector corresponding to the age group ’15-60 years’.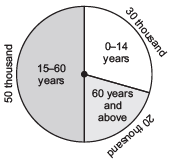
3. The favourate flavours of ice-creams for students of a school is given in percentages as follows:
Flavours | Percentage of students Preferring the flavours |
Chocolate | 50% |
Vanilla | 25% |
Other flavours | 25% |
Represent the data in a pie chart.
4. The adjoining pie chart gives the expenditure (in percentages) on various items and savings of a family during a month.
(i) On which item, the expenditure was minimum?
(ii) Expenditure on which item is equal to the total saving of the family?
(iii) If the monthly saving of the family is Rs 3000, then what is the monthly expenditure on clothes?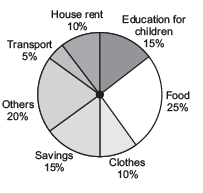
5. On a particular day, the sales (in rupees) of various items of baker’s shop are given below. Draw a pie chart for this data:
| ordinary bread | 320 |
| fruit bread | 80 |
| biscuits | 120 |
| cakes and pastries | 160 |
| others | 40 |
| Total | 720 |
ANSWERS
1. (i) Sleep
(ii) Play and others
(iii) Sleep 120°, school 90°, how work 60°; play 45°, others 45°
2. (i) 15–60 years
(ii) 30 thousand
(iii) 180°
4. (i) Transport
(ii) Education for children
(iii) Rs 2000
Worksheet Questions (Part - 3)
1. List the possible outcomes in the adjoining spinning wheel.
2. (i) A die is thrown. List the possible outcomes.
(ii) What is probability of getting a factor of 6?
Hint: Factors of six are 1, 2, 3 and 6.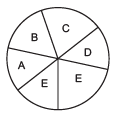
(iii) What is the probability of getting a number greater than 6?
Note: A die does not have a number greater than 6 on its face. Therefore, the possible outcomes are zero.
3. (i) Find the number of outcomes of getting a sector containing G.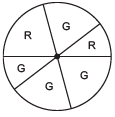
(ii) What is the probability of getting a sector containing R?
4. A bag has 4-red balls and 2 yellow balls such that the balls are identical in all repeats other than colour. A ball is drawn from the bag without looking into the bag. What is the probability of getting yellow ball?
ANSWERS
1. A, B, C, D, E
2. (i) 1, 2, 3, 4, 5, 6
(ii) 2/3
(iii) 0
3. 4
4. 1/3
The document Class 8 Maths - Data Handling CBSE Worksheets is a part of the Class 8 Course Mathematics (Maths) Class 8.
All you need of Class 8 at this link: Class 8
|
81 videos|409 docs|31 tests
|


FAQs on Class 8 Maths - Data Handling CBSE Worksheets
| 1. What is data handling and why is it important in education? |  |
| 2. What are some common methods of data collection used in data handling? | |
Ans.Common methods of data collection in data handling include surveys, experiments, observations, and using existing datasets. Each method has its own strengths and weaknesses depending on the research question and context.
| 3. How can students effectively represent data visually? | |
Ans.Students can effectively represent data visually using charts, graphs, and tables. Common visual representations include bar graphs, pie charts, line graphs, and histograms, which help make complex data easier to understand.
| 4. What are the key steps involved in analyzing data? | |
Ans.The key steps involved in analyzing data include defining the problem, collecting data, organizing data, performing statistical analysis, interpreting results, and presenting findings. Each step is crucial for ensuring accurate conclusions.
| 5. How can data handling skills be applied in real-life situations? | |
Ans.Data handling skills can be applied in various real-life situations such as budgeting, market research, health studies, and decision-making processes in businesses. These skills help individuals analyze trends and make evidence-based decisions.
Related Exams
About this Document

4.2K Views

4.68/5
Rating

Feb 26, 2025
Last updated
Document Description: Worksheet Questions - Data Handling for Class 8 2025 is part of Mathematics (Maths) Class 8 preparation.
The notes and questions for Worksheet Questions - Data Handling have been prepared according to the Class 8 exam syllabus. Information about Worksheet Questions - Data Handling covers topics
like and Worksheet Questions - Data Handling Example, for Class 8 2025 Exam. Find important definitions, questions, notes, meanings, examples, exercises and tests below for Worksheet Questions - Data Handling.
Introduction of Worksheet Questions - Data Handling in English is available as part of our Mathematics (Maths) Class 8
for Class 8 & Worksheet Questions - Data Handling in Hindi for Mathematics (Maths) Class 8 course.
Download more important topics related with notes, lectures and mock test series for Class 8
Exam by signing up for free. Class 8: Class 8 Maths - Data Handling CBSE Worksheets
Description
Full syllabus notes, lecture & questions for Class 8 Maths - Data Handling CBSE Worksheets - Class 8 | Plus excerises question with solution to help you revise complete syllabus for Mathematics (Maths) Class 8 | Best notes, free PDF download
Information about Worksheet Questions - Data Handling
In this doc you can find the meaning of Worksheet Questions - Data Handling defined & explained in the simplest way possible. Besides explaining types of
Worksheet Questions - Data Handling theory, EduRev gives you an ample number of questions to practice Worksheet Questions - Data Handling tests, examples and also practice Class 8
tests

Related Searches
study material
,Class 8 Maths - Data Handling CBSE Worksheets
,Class 8 Maths - Data Handling CBSE Worksheets
,Objective type Questions
,Previous Year Questions with Solutions
,Sample Paper
,Extra Questions
,practice quizzes
,video lectures
,Important questions
,past year papers
,ppt
,Free
,MCQs
,Viva Questions
,Semester Notes
,mock tests for examination
,shortcuts and tricks
,Summary
,Exam
,Class 8 Maths - Data Handling CBSE Worksheets
,


Additional Information about Worksheet Questions - Data Handling for Class 8 Preparation
Worksheet Questions - Data Handling Free PDF Download
The Worksheet Questions - Data Handling is an invaluable resource that delves deep into the core of the Class 8 exam.
These study notes are curated by experts and cover all the essential topics and concepts, making your preparation more efficient and effective.
With the help of these notes, you can grasp complex subjects quickly, revise important points easily,
and reinforce your understanding of key concepts. The study notes are presented in a concise and easy-to-understand manner,
allowing you to optimize your learning process. Whether you're looking for best-recommended books, sample papers, study material,
or toppers' notes, this PDF has got you covered. Download the Worksheet Questions - Data Handling now and kickstart your journey towards success in the Class 8 exam.
Importance of Worksheet Questions - Data Handling
The importance of Worksheet Questions - Data Handling cannot be overstated, especially for Class 8 aspirants.
This document holds the key to success in the Class 8 exam.
It offers a detailed understanding of the concept, providing invaluable insights into the topic.
By knowing the concepts well in advance, students can plan their preparation effectively.
Utilize this indispensable guide for a well-rounded preparation and achieve your desired results.
Worksheet Questions - Data Handling Notes
Worksheet Questions - Data Handling Notes offer in-depth insights into the specific topic to help you master it with ease.
This comprehensive document covers all aspects related to Worksheet Questions - Data Handling.
It includes detailed information about the exam syllabus, recommended books, and study materials for a well-rounded preparation.
Practice papers and question papers enable you to assess your progress effectively.
Additionally, the paper analysis provides valuable tips for tackling the exam strategically.
Access to Toppers' notes gives you an edge in understanding complex concepts.
Whether you're a beginner or aiming for advanced proficiency, Worksheet Questions - Data Handling Notes on EduRev are your ultimate resource for success.
Worksheet Questions - Data Handling Class 8
The "Worksheet Questions - Data Handling Class 8 Questions" guide is a valuable resource for all aspiring students preparing for the
Class 8 exam. It focuses on providing a wide range of practice questions to help students gauge
their understanding of the exam topics. These questions cover the entire syllabus, ensuring comprehensive preparation.
The guide includes previous years' question papers for students to familiarize themselves with the exam's format and difficulty level.
Additionally, it offers subject-specific question banks, allowing students to focus on weak areas and improve their performance.
Study Worksheet Questions - Data Handling on the App
Students of Class 8 can study Worksheet Questions - Data Handling alongwith tests & analysis from the EduRev app,
which will help them while preparing for their exam. Apart from the Worksheet Questions - Data Handling,
students can also utilize the EduRev App for other study materials such as previous year question papers, syllabus, important questions, etc.
The EduRev App will make your learning easier as you can access it from anywhere you want.
The content of Worksheet Questions - Data Handling is prepared as per the latest Class 8 syllabus.
|
© EduRev
|
Education Revolution
|


|


Signup to see your scores
go up
within 7 days!
within 7 days!
Takes less than 10 seconds to signup