CA Foundation Exam > CA Foundation Notes > Quantitative Aptitude for CA Foundation > Summary - Dispersion (Measures of Central Tendency)
Dispersion (Measures of Central Tendency) Summary | Quantitative Aptitude for CA Foundation PDF Download
Introduction

- All these merits of standard deviation make SD as the most widely and commonly used measure of dispersion.
- Range is the quickest to compute and as such, has its application in statistical quality control. However, range is based on only two observations and affected too much by the presence of extreme observation(s).
- Mean deviation is rigidly defined, based on all the observations and not much affected by sampling fluctuations. However, mean deviation is difficult to comprehend and its computation is also time consuming and laborious. Furthermore, unlike SD, mean deviation does not possess mathematical properties.
- Quartile deviation is also rigidly defined, easy to compute and not much affected by sampling fluctuations. The presence of extreme observations has no impact on quartile deviation since quartile deviation is based on the central fifty-percent of the observations. However, quartile deviation is not based on all the observations and it has no desirable mathematical properties. Nevertheless, quartile deviation is the best measure of dispersion for open-end classifications.
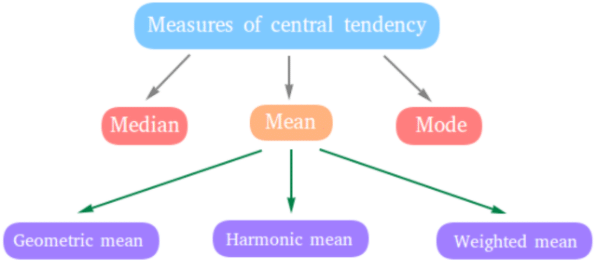
Measure of central tendency
 This is the average of a population - allowing the population to be represented by a single value.
Examples:
- Median is the middle number in a data set that is ordered from least to greatest.
- Mode is the number that occurs most often in a data set.
- Arithmetic mean is the average of a set of numerical values.
- Geometric mean is the nth root of the product of n numbers.
Degree of dispersion
 These describe the dispersion of data around some sort of mean.
- Range: The highest and the lowest score.
- Interquartile range: The difference between 75th and 25th percentiles.
- Percentile: The percentage band into which the score falls (mean = the 50th percentile)
- Deviation: Distance between an observed score and the mean score. Because the difference can be positive or negative and this is cumbersome, usually the absolute deviation is used (which ignores the plus or minus sign).
- Variance: Deviation squared.
- Standard deviation: Square root of variance.
- Measure of the average spread of individual samples from the mean.
- Reporting the SD along with the mean gives one the impression of how valid that mean value actually is (i.e. if the SD is huge, the mean is totally invalid - it is not an accurate measure of central tendency, because the data is so widely scattered.)
- Standard error
- This is an estimate of spread of samples around the population mean.
- You don't known the population mean- you only know the sample mean and the standard deviation for your sample, but if the standard deviation is large, the sample mean may be rather far from the population mean. How far is it? The SE can estimate this.
- Mean absolute deviation is the average of the absolute deviations from a central point for all data. As such, it is a summary of the net statistical variability in the data set. On average, it says, the data is this different from this central point.
- Coefficient of variation, also known as "relative standard deviation", is the SD divided by the mean. As a dimensionless number, it allows comparisons between different data sets (i.e. ones using different units).
Standard Error (SE) = SD / square root of n
The variability among sample means will be increased if there is (a) a wide variability of individual data and (b) small samples
- SE is used to calculate the confidence interval.
Shape of the data
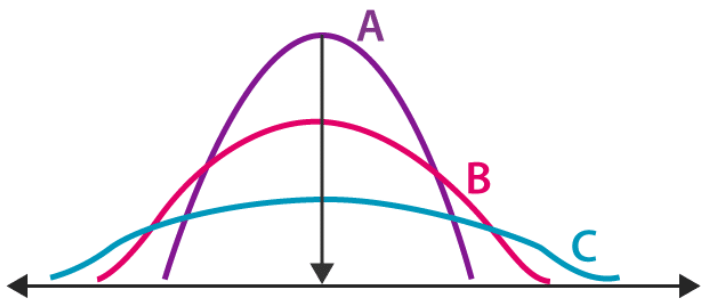
- This vaguely refers to the shape of the probability distribution bell curve.
- Skewness is a measure of the assymetry of the probability distribution - the tendency of the bell curve to be assymmetrical.
- Kurtosis or "peakedness" describes the width and height of the peak of the bell curve, i.e. the tendency for the scores to gather around the middle of the bell curve.
- A normal distribution is a perfectly symmetrical bell curve, and is not skewed.
Point estimate
According to the college, point estimate is "a single value estimate of a population parameter. It represents a descriptive statistic for a summary measure, or a measure of central tendency from a given population sample." For example, in a population there exists a "true" average height; the point estimate of this average height is the average height of a sample group taken from that population.
Confidence interval
- The range of values within which the "actual" result is found.
- A CI of 95% means that if a trial was repeated an infinite number of times, 95% of the results would fall within this range of values.
- The CI gives an indication of the precision of the sample mean as an estimate of the "true" population mean.
- A wide CI can be caused by small samples or by a large variance within a sample.
The document Dispersion (Measures of Central Tendency) Summary | Quantitative Aptitude for CA Foundation is a part of the CA Foundation Course Quantitative Aptitude for CA Foundation.
All you need of CA Foundation at this link: CA Foundation
|
114 videos|276 docs|89 tests
|
FAQs on Dispersion (Measures of Central Tendency) Summary - Quantitative Aptitude for CA Foundation
| 1. What is dispersion in statistics? |  |
Ans. Dispersion in statistics refers to the measure of how spread out or scattered the data points are in a dataset. It provides information about the variability or diversity within the dataset.
| 2. What are the commonly used measures of dispersion? |  |
Ans. The commonly used measures of dispersion in statistics are range, variance, and standard deviation. Range measures the difference between the maximum and minimum values in a dataset. Variance measures the average squared deviation of each data point from the mean. Standard deviation is the square root of variance and provides a more easily interpretable measure of dispersion.
| 3. How is range calculated? |  |
Ans. Range is calculated by subtracting the minimum value from the maximum value in a dataset. For example, if the minimum value is 10 and the maximum value is 25, then the range would be 25 - 10 = 15.
| 4. What does variance indicate in statistics? |  |
Ans. Variance in statistics indicates the average squared deviation of each data point from the mean. It measures how far each data point is from the mean, on average. A higher variance indicates a greater spread or dispersion of data points, while a lower variance indicates a lesser spread.
| 5. How is standard deviation related to variance? |  |
Ans. Standard deviation is the square root of variance. It is a more commonly used measure of dispersion because it is in the same unit as the original data. While variance provides the average squared deviation, standard deviation provides the average deviation of data points from the mean.
Related Searches


