
Best Study Material for CA Foundation Exam
CA Foundation Exam > CA Foundation Notes > ICAI Notes: Correlation And Regression- 2
ICAI Notes: Correlation And Regression- 2 - CA Foundation PDF Download
SUMMARY
The change in one variable is reciprocated by a corresponding change in the other variable either directly or inversely, then the two variables are known to be associated or correlated.
There are two types of correlation.
(i) Positive correlation
(ii) Negative correlation
We consider the following measures of correlation:
(a) Scatter diagram: This is a simple diagrammatic method to establish correlation between a pair of variables.
(b) Karl Pearson’s Product moment correlation coefficient: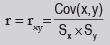
A single formula for computing correlation coefficient is given by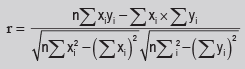
(i) The Coefficient of Correlation is a unit-free measure.
(ii) The coefficient of correlation remains invariant under a change of origin and/or scale of the variables under consideration depending on the sign of scale factors.
(iii) The coefficient of correlation always lies between –1 and 1, including both the limiting values i.e. –1 ≤ r ≤ + 1
(c) Spearman’s rank correlation co-efficient: Spearman’s rank correlation coefficient is given by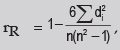 where rR denotes rank correlation coefficient and it lies between – 1 and 1 inclusive of these two values.di = xi – yi represents the difference in ranks for the i-th individual and n denotes the number of individuals.
In case u individuals receive the same rank, we describe it as a tied rank of length u.
In case of a tied rank,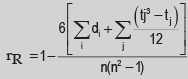
In this formula, tj represents the jth tie length and the summation extends over the lengths of all the ties for both the series.
(d) Co-efficient of concurrent deviations: The coefficient of concurrent deviation is given by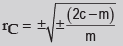
If (2c–m) >0, then we take the positive sign both inside and outside the radical sign and if (2c–m) <0, we are to consider the negative sign both inside and outside the radical sign.
- In regression analysis, we are concerned with the estimation of one variable for given value of another variable (or for a given set of values of a number of variables) on the basis of an average mathematical relationship between the two variables (or a number of variables).
- In case of a simple regression model if y depends on x, then the regression line of y on x in given by y = a + b, here a and b are two constants and they are also known as regression parameters. Furthermore, b is also known as the regression coefficient of y on x and is also denoted by byx
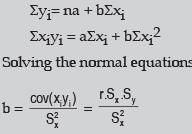
- The method of least squares is solving the equations of regression lines
The normal equations are
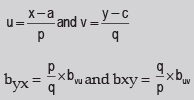
- The regression coefficients remain unchanged due to a shift of origin but change due to a shift of scale. This property states that if the original pair of variables is (x, y) and if they are changed to the pair (u, v) where
- The two lines of regression intersect at the point , where x and y are the variables under consideration.
According to this property, the point of intersection of the regression line of y on x and the regression line of x on y is i.e. the solution of the simultaneous equations in x and y. - The coefficient of correlation between two variables x and y in the simple geometric mean of the two regression coefficients. The sign of the correlation coefficient would be the common sign of the two regression coefficients.

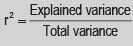
- Correlation coefficient measuring a linear relationship between the two variables indicates the amount of variation of one variable accounted for by the other variable. A better measure for this purpose is provided by the square of the correlation coefficient, Known as ‘coefficient of determination’. This can be interpreted as the ratio between the explained variance to total variance i.e.
- The ‘coefficient of non-determination’ is given by (1–r2) and can be interpreted as the ratio of unexplained variance to the total variance.
- The two lines of regression coincide i.e. become identical when r = –1 or 1 or in other words, there is a perfect negative or positive correlation between the two variables under discussion. If r = 0 Regression lines are perpendicular to each other.
The document ICAI Notes: Correlation And Regression- 2 - CA Foundation is a part of CA Foundation category.
All you need of CA Foundation at this link: CA Foundation


FAQs on ICAI Notes: Correlation And Regression- 2 - CA Foundation
| 1. What is correlation and regression? |  |
| 2. How is correlation coefficient calculated? | |
Ans. The correlation coefficient is a statistical measure that ranges from -1 to +1 and indicates the strength and direction of the relationship between two variables. It is calculated by dividing the covariance of the variables by the product of their standard deviations.
| 3. What is the difference between positive and negative correlation? | |
Ans. In positive correlation, two variables increase or decrease together. This means that as one variable increases, the other variable also tends to increase. In negative correlation, one variable increases while the other variable decreases. This indicates an inverse relationship between the two variables.
| 4. How is regression used in forecasting? | |
Ans. Regression analysis is commonly used in forecasting to predict the value of a dependent variable based on the values of one or more independent variables. By analyzing the historical relationship between the variables, regression helps in estimating future values and making predictions.
| 5. Can correlation imply causation? | |
Ans. No, correlation does not imply causation. Just because two variables are correlated does not mean that one variable causes the other to change. Correlation only indicates a relationship, and further research is required to establish a cause-and-effect relationship between variables.
Related Exams
About this Document

1.2K Views

4.65/5
Rating

Apr 21, 2025
Last updated
Document Description: ICAI Notes: Correlation And Regression- 2 for CA Foundation 2025 is part of CA Foundation preparation. The notes and questions for ICAI Notes: Correlation And Regression- 2 have been prepared according to the CA Foundation exam syllabus. Information about ICAI Notes: Correlation And Regression- 2 covers topics like and ICAI Notes: Correlation And Regression- 2 Example, for CA Foundation 2025 Exam. Find important definitions, questions, notes, meanings, examples, exercises and tests below for ICAI Notes: Correlation And Regression- 2.
Introduction of ICAI Notes: Correlation And Regression- 2 in English is available as part of
our CA Foundation preparation & ICAI Notes: Correlation And Regression- 2 in Hindi for CA Foundation
courses. Download more important topics, notes, lectures and mock test series for CA Foundation
Exam by signing up for free. CA Foundation: ICAI Notes: Correlation And Regression- 2 - CA Foundation
Description
Full syllabus notes, lecture & questions for ICAI Notes: Correlation And Regression- 2 - CA Foundation - CA Foundation | Plus excerises question with solution to help you revise complete syllabus | Best notes, free PDF download
Information about ICAI Notes: Correlation And Regression- 2
In this doc you can find the meaning of ICAI Notes: Correlation And Regression- 2 defined & explained in the simplest way possible.
Besides explaining types of ICAI Notes: Correlation And Regression- 2 theory,
EduRev gives you an ample number of questions to practice ICAI Notes: Correlation And Regression- 2 tests, examples and also practice CA Foundation tests.
Download as PDF

Related Searches
Important questions
,ICAI Notes: Correlation And Regression- 2 - CA Foundation
,Sample Paper
,Viva Questions
,Previous Year Questions with Solutions
,ppt
,Semester Notes
,ICAI Notes: Correlation And Regression- 2 - CA Foundation
,MCQs
,ICAI Notes: Correlation And Regression- 2 - CA Foundation
,Free
,Objective type Questions
,Exam
,video lectures
,practice quizzes
,study material
,shortcuts and tricks
,past year papers
,mock tests for examination
,Extra Questions
,Summary
;


Additional Information about ICAI Notes: Correlation And Regression- 2 for CA Foundation Preparation
ICAI Notes: Correlation And Regression- 2 Free PDF Download
The ICAI Notes: Correlation And Regression- 2 is an invaluable resource that delves deep into the core of the CA Foundation exam.
These study notes are curated by experts and cover all the essential topics and concepts, making your preparation more efficient and effective.
With the help of these notes, you can grasp complex subjects quickly, revise important points easily,
and reinforce your understanding of key concepts. The study notes are presented in a concise and easy-to-understand manner,
allowing you to optimize your learning process. Whether you're looking for best-recommended books, sample papers, study material,
or toppers' notes, this PDF has got you covered. Download the ICAI Notes: Correlation And Regression- 2 now and kickstart your journey towards success in the CA Foundation exam.
Importance of ICAI Notes: Correlation And Regression- 2
The importance of ICAI Notes: Correlation And Regression- 2 cannot be overstated, especially for CA Foundation aspirants.
This document holds the key to success in the CA Foundation exam.
It offers a detailed understanding of the concept, providing invaluable insights into the topic.
By knowing the concepts well in advance, students can plan their preparation effectively.
Utilize this indispensable guide for a well-rounded preparation and achieve your desired results.
ICAI Notes: Correlation And Regression- 2
ICAI Notes: Correlation And Regression- 2 Notes offer in-depth insights into the specific topic to help you master it with ease.
This comprehensive document covers all aspects related to ICAI Notes: Correlation And Regression- 2.
It includes detailed information about the exam syllabus, recommended books, and study materials for a well-rounded preparation.
Practice papers and question papers enable you to assess your progress effectively.
Additionally, the paper analysis provides valuable tips for tackling the exam strategically.
Access to Toppers' notes gives you an edge in understanding complex concepts.
Whether you're a beginner or aiming for advanced proficiency, ICAI Notes: Correlation And Regression- 2 Notes on EduRev are your ultimate resource for success.
ICAI Notes: Correlation And Regression- 2 CA Foundation Questions
The "ICAI Notes: Correlation And Regression- 2 CA Foundation Questions" guide is a valuable resource for all aspiring students preparing for the
CA Foundation exam. It focuses on providing a wide range of practice questions to help students gauge
their understanding of the exam topics. These questions cover the entire syllabus, ensuring comprehensive preparation.
The guide includes previous years' question papers for students to familiarize themselves with the exam's format and difficulty level.
Additionally, it offers subject-specific question banks, allowing students to focus on weak areas and improve their performance.
Study ICAI Notes: Correlation And Regression- 2 on the App
Students of CA Foundation can study ICAI Notes: Correlation And Regression- 2 alongwith tests & analysis from the EduRev app,
which will help them while preparing for their exam. Apart from the ICAI Notes: Correlation And Regression- 2,
students can also utilize the EduRev App for other study materials such as previous year question papers, syllabus, important questions, etc.
The EduRev App will make your learning easier as you can access it from anywhere you want.
The content of ICAI Notes: Correlation And Regression- 2 is prepared as per the latest CA Foundation syllabus.
|
© EduRev
|
Education Revolution
|


|


Signup to see your scores
go up
within 7 days!
within 7 days!
Takes less than 10 seconds to signup