Introduction to Statistics

Statistics is the practice or science of collecting and analysing numerical data in large quantities, especially for the purpose of inferring proportions in a whole from those in a representative sample.
There are two broad categories in statistics:
- Descriptive statistics
- Inferential statistics
Descriptive Statistics
Descriptive statistics summarises and organises data so that it can be easily understood. Its purpose is to give a clear overview of the main features of a data set.
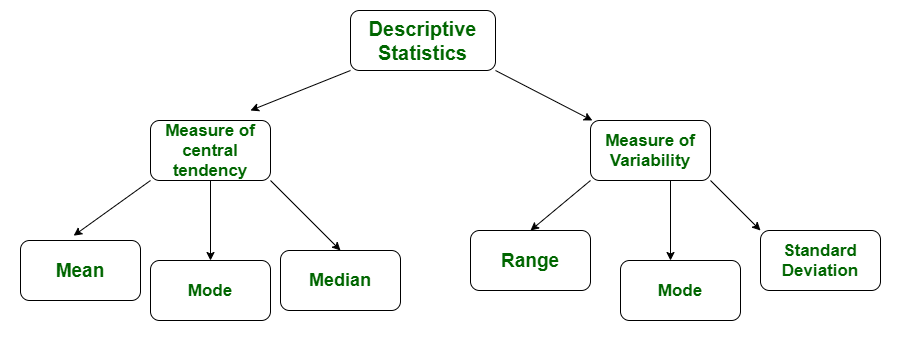
Categories of Descriptive Statistics
- Measures of Central Tendency - locate the centre or typical value of a distribution (for example: mean, median, mode).
- Measures of Dispersion or Variation - describe how spread out the values are (for example: range, variance, standard deviation).
- Measures of Position - describe relative standing of values in a distribution (for example: percentiles, quartiles, rank scores).
Measures of Central Tendency
- Measures of central tendency refer to a value that represents the centre point of a data set.
- The most commonly used measures are mean, median, and mode.
Mean
The arithmetic mean (often called the average) of a set of numbers is the sum of the elements divided by the number of elements.
Formula:
Mean = Sum of all elements ÷ Number of elements
Example
Q. Tom scored 88 in English, 97 in Math, 90 in Science and 85 in Social Studies. Calculate his average marks.
Solution:
Mean = (88 + 97 + 90 + 85) ÷ 4
Mean = 360 ÷ 4
Mean = 90
Try yourself: The arithmetic mean of 4,6,8 is
Median
The median of a data set is the middle value when the numbers are arranged in ascending or descending order. If the number of observations is even, the median is the mean of the two middle values.
- When a data set has an odd number of elements, take the middle value.
- When a data set has an even number of elements, take the average of the two middle values.
Examples
Q.1. Find the median of the set {4, 7, 1, 0, 9}.
Solution:
Arrange in order: {0, 1, 4, 7, 9}
Median = 4
Q.2. Find the median of the set {3, 2, 5, 10, 8, 7}.
Solution:
Arrange in order: {2, 3, 5, 7, 8, 10}
Median = (5 + 7) ÷ 2
Median = 6
Note: When a set is evenly spaced (the difference between consecutive elements is constant), the mean and the median are equal.
Q.3. Find the mean and median of the set {4, 8, 10, 6}.
Solution:
Mean = (4 + 8 + 10 + 6) ÷ 4
Mean = 28 ÷ 4
Mean = 7
Arrange in order: {4, 6, 8, 10}
Median = (6 + 8) ÷ 2
Median = 7
Try yourself: The George family drove through 11 states on their Spring vacation. Gasoline prices varied from state to state. Find the median gasoline price.
42,54,12,89,56,75,29,13,20,11,34
Mode
The mode of a data set is the value that appears most frequently. A set can have one mode (unimodal), more than one mode (multimodal or bimodal), or no mode.
Examples
Q.1. 3, 4, 7, 3, 1, 2, 3, 9, 13
Solution: Mode = 3
Q.2. 21, 34, 9, 57, 64, 34, 90, 9, 12, 2, 34, 9
Solution: Modes = 34 and 9 (bimodal)
Q.3. 6, 7, 36, 2, 1, 41
Solution: No mode (all values occur once)
Q.4. The mean of 2, 6, 9, 13, x is 9. Find the median of {22, x, 38, 11, 5, 9}.
Solution:
(2 + 6 + 9 + 13 + x) ÷ 5 = 9
30 + x = 45
x = 15
Arrange the second set: {5, 9, 11, 15, 22, 38}
Median = (11 + 15) ÷ 2
Median = 13
Measures of Dispersion
Dispersion measures describe how stretched or squeezed a distribution is. We focus on two common measures: range and standard deviation.
Range
The range is the simplest measure of dispersion; it is the difference between the largest and smallest values in the data set.
Example: For {3, 4, 10, 14, 8}, Range = 14 - 3 = 11.
Standard Deviation
The standard deviation quantifies the average distance of data points from the mean. It is the square root of the variance. The usual calculation steps are:
- Find the arithmetic mean of the data set.
- Find each value's deviation from the mean (value - mean).
- Square each deviation.
- Find the mean of the squared deviations (this is the variance).
- Take the square root of the variance to obtain the standard deviation.
Example. Calculate the standard deviation for the set {3, 4, 8, 10}.
Solution:
Find the mean.
Mean = (3 + 4 + 8 + 10) ÷ 4
Mean = 25 ÷ 4
Mean = 6.25
Find deviations from the mean for each number.
3 - 6.25 = -3.25
4 - 6.25 = -2.25
8 - 6.25 = 1.75
10 - 6.25 = 3.75
Square each deviation.
(-3.25)² = 10.5625
(-2.25)² = 5.0625
(1.75)² = 3.0625
(3.75)² = 14.0625
Find the mean of the squared deviations (variance).
Variance = (10.5625 + 5.0625 + 3.0625 + 14.0625) ÷ 4
Variance = 32.75 ÷ 4
Variance = 8.1875
Take the square root of the variance to get the standard deviation.
Standard deviation = √8.1875
Standard deviation ≈ 2.86 (rounded to two decimal places)
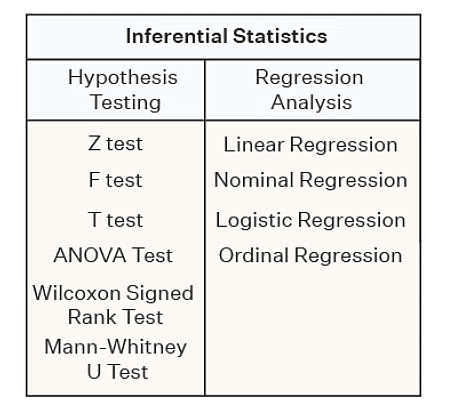
Inferential Statistics
- Inferential statistics uses a sample of data to make generalisations or predictions about a larger population.
- It provides methods to estimate population parameters, test hypotheses, and make predictions with quantifiable uncertainty.
- To select representative samples, common sampling techniques include simple random sampling, stratified sampling, cluster sampling, and systematic sampling.
Some Solved Questions
Q.1. If the mean of numbers 28, x, 42, 78 and 104 is 62, what is the mean of 48, 62, 98, 124, and x?
a) 78
b) 58
c) 390
d) 310
e) 66
Answer: Option A
Solution:
Find the sum of the four known numbers in the first series (excluding x).
Sum = 28 + 42 + 78 + 104
Sum = 252
Find the sum of the four known numbers in the second series (excluding x).
Sum = 48 + 62 + 98 + 124
Sum = 332
Difference in sums = 332 - 252
Difference = 80
Since each series has 5 numbers, the difference in average = 80 ÷ 5
Difference in average = 16
Average of the first series = 62
Average of the second series = 62 + 16
Average of the second series = 78
Alternative approach: Each of the four known numbers in the new series is 20 greater than the corresponding known number in the first series; this increases the total by 4 × 20 = 80, and so the average increases by 80 ÷ 5 = 16, giving 78.
Q.2. The arithmetic mean of the 5 consecutive integers starting with 's' is 'a'. What is the arithmetic mean of 9 consecutive integers that start with s + 2 ?
a) 2 + s + a
b) 22 + a
c) 2s
d) 2a + 2
e) 4 + a
Answer: Option E
Solution:
The mean of 5 consecutive integers is the middle (third) term.
The five terms are s, s + 1, s + 2, s + 3, s + 4.
Thus a = s + 2.
The nine consecutive integers starting from s + 2 are:
s + 2, s + 3, s + 4, s + 5, s + 6, s + 7, s + 8, s + 9, s + 10.
The mean of nine consecutive integers is the middle (fifth) term, which is s + 6.
Since a = s + 2, the required mean = a + 4.
Alternative (check) approach:
Assume s = 1 to verify.
Five numbers: 1, 2, 3, 4, 5 → mean = 3, so a = 3.
Nine numbers starting at s + 2 = 3: 3, 4, 5, 6, 7, 8, 9, 10, 11 → mean = 7 = 3 + 4 = a + 4.
Q.3. The average weight of a group of 30 friends increases by 1 kg when the weight of their football coach was added. If the average weight of the group after including the weight of the football coach is 31 kg, what is the weight of their football coach?
a) 31 kg
b) 61 kg
c) 60 kg
d) 62 kg
e) 91 kg
Answer: Option B
Solution:
Old average (without coach) = 31 - 1
Old average = 30 kg
Total weight of 30 friends = 30 × 30
Total weight = 900 kg
Total weight after including coach = 31 × 31
Total weight = 961 kg
Weight of coach = 961 - 900
Weight of coach = 61 kg
Description Number Average Sum Without Coach 30 30 900 With Coach 31 31 961 Weight of Coach 961 - 900 = 61 kg
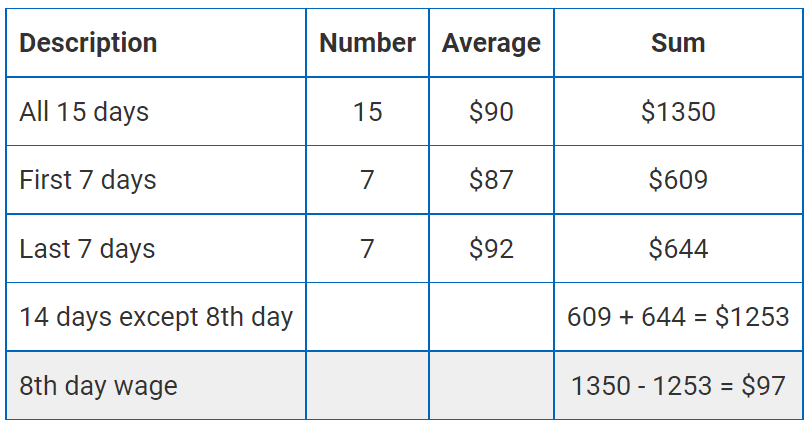
Q.4. The average wages of a worker during a fortnight comprising 15 consecutive working days was $90 per day. During the first 7 days, his average wages was $87/day and the average wages during the last 7 days was $92 /day. What was his wage on the 8th day?
a) $83
b) $92
c) $90
d) $97
e) $104
Answer: Option D
Solution:
Total wages for 15 days = 15 × 90
Total wages = $1350
Total wages for first 7 days = 7 × 87
Total wages = $609
Total wages for last 7 days = 7 × 92
Total wages = $644
Total for all 15 days = wages for first 7 days + wage on 8th day + wages for last 7 days
1350 = 609 + wage on 8th day + 644
Wage on 8th day = 1350 - 609 - 644
Wage on 8th day = $97
Q.5. The average of 5 numbers is 6. The average of 3 of them is 8. What is the average of the remaining two numbers?
a) 4
b) 5
c) 3
d) 3.5
e) 0.5
Answer: Option C
Solution:
Sum of all 5 numbers = 5 × 6
Sum = 30
Sum of the 3 numbers = 3 × 8
Sum = 24
Sum of the remaining two numbers = 30 - 24
Sum = 6
Average of the two numbers = 6 ÷ 2
Average = 3
Summary (optional)
This chapter introduced the basic ideas of statistics: how data can be described using measures of central tendency (mean, median, mode), how dispersion is measured (range, variance, standard deviation), and the distinction between descriptive and inferential statistics. Worked examples and solved questions demonstrate standard methods for computing averages, medians, modes, and standard deviation, and illustrate common problem-solving frameworks used in competitive and school examinations.
FAQs on Introduction to Statistics
| 1. What is the purpose of descriptive statistics? |  |
| 2. What are measures of central tendency? | |
| 3. How do measures of dispersion help in understanding data variability? | |
| 4. What is the difference between descriptive and inferential statistics? | |
| 5. How are statistics useful in everyday life? | |


