Venn Diagrams and Operations on Sets | Algebra - Mathematics PDF Download
| Table of contents |
|
| Venn Diagrams |
|
| Representation of Sets in a Venn Diagram |
|
| Operations on Sets |
|
| Solved Examples |
|

Venn Diagrams
- A Venn diagram is a diagrammatic representation of ALL the possible relationships between different sets of a finite number of elements.
- Venn diagrams were conceived around 1880 by John Venn, an English logician, and philosopher.
- A Venn diagram is also known as a Primary diagram, Set diagram or Logic diagram.
Representation of Sets in a Venn Diagram
It is done as per the following:
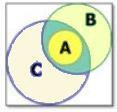
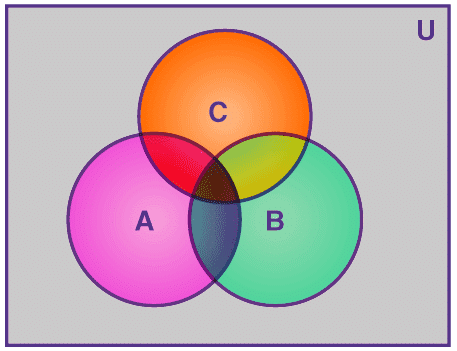
- Each individual set is represented mostly by a circle and enclosed within a quadrilateral (the quadrilateral represents the finiteness of the Venn diagram as well as the Universal set.)
- Labelling is done for each set with the set’s name to indicate difference and the respective constituting elements of each set are written within the circles.
- Sets having no element in common are represented separately while those having some of the elements common within them are shown with overlapping.
- The elements are written within the circle representing the set containing them and the common elements are written in the parts of circles that are overlapped.
Operations on Sets
Just like the mathematical operations on sets like Union, Difference, Intersection, Complement, etc. we have operations on Venn diagrams that are given as follows:
1. Union of Sets
- Let A = {2, 4, 6, 8} and B = {6, 8, 10, 12}.
- Represent A U B through a well-labeled Venn diagram.
- The orange colored patch represents the common elements {6, 8} and the quadrilateral represents A U B.
Properties of A U B
- The commutative law holds true as A U B = B U A
- The associative law also holds true as (A U B) U C = A U (B U C)
- A U φ = A (Law of identity element)
- Idempotent Law – A U A = A
- Law of the Universal Set U – A U U = U
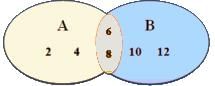
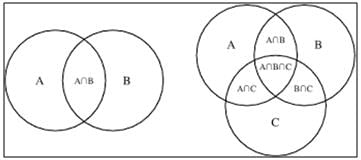
2. Intersection of Sets
- An intersection is nothing but the collection of all the elements that are common to all the sets under consideration. Let A = {2, 4, 6, 8} and B = {6, 8, 10, 12} then A ∩ B is represented through a Venn diagram as per following:

- The orange colored patch represents the common elements {6, 8} as well as the A ∩ B. The intersection of 2 or more sets is the overlapped part(s) of the individual circles with the elements written in the overlapped parts.
- Example:
Properties of A ∩ B
- Commutative law – A ∩ B = B∩ A
- Associative law – (A ∩ B)∩ C = A ∩ (B∩ C)
- φ ∩ A = φ
- U ∩ A = A
- A∩ A = A; Idempotent law.
- Distributive law – A ∩ (B∩ C) = (A ∩ B) U(A ∩ C)
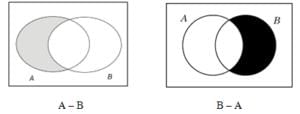
3. Difference of Sets
- The difference of set A and B is represented as: A – B = {x: x ϵ A and x ϵ B} {converse holds true for B – A}. Let, A = {1, 2, 3, 4, 5, 6} and B = {2, 4, 6, 8} then A – B = {1, 3, 5} and B – A = {8}. The sets (A – B), (B – A) and (A ∩ B) are mutually disjoint sets.
- It means that there is NO element common to any of the three sets and the intersection of any of the two or all the three sets will result in a null or void or empty set. A – B and B – A are represented through Venn diagrams as follows:
4. Complement of Sets
- If U represents the Universal set and any set A is the subset of A then the complement of set A (represented as A’) will contain ALL the elements which belong to the Universal set U but NOT to set A.
- Mathematically – A’ = U – A
- Alternatively, the complement of a set A, A’ is the difference between the universal set U and the set A. Example: Let universal set U = {1, 2, 3, 4, 5, 6, 7, 8, 9, 10} and set A = {1, 3, 5, 7, 9}, then complement of A is given as: A’ = U – A = {2, 4, 6, 8, 10}
Properties Of Complement Sets
A U A’ = U
A ∩ A’ = φ
De Morgan’s Law – (A U B)’ = A’ ∩ B’ OR (A ∩ B)’ = A’ U B’
Law of double complementation : (A’)’ = A
φ’ = U
U’ = φ
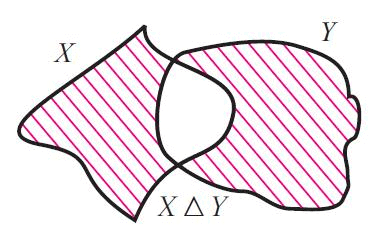
4. Symmetric difference
- Let X and Y be two sets.
- Now, we can define the following new set.
- X Δ Y = (X \ Y) u (Y \ X)
- X ΔY is read as "X symmetric difference Y"
- Now that X Δ Y contains all elements in X u Y which are not in X n Y and the figure given below illustrates this. .
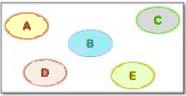
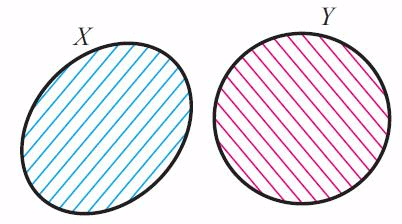
5. Disjoint sets
- Two sets X and Y are said to be disjoint if they do not have any common element. That is,
- X and Y are disjoint if X n Y = {}
- It is clear that n(A u B) = n(A) + n(B), if A and B are disjoint finite set.
Solved Examples
Example 1: Consider the relations.
a) A – B = A – (A ∩ B)
b) A = (A ∩ B) ∪ (A – B)
c) A – (B ∩ C) = (A – B) ∪ (A – C)
Which of these options is/are correct?
(a) a and c
(b) b only
(c) b and c
(d) a and b
Ans: (d)
a) A – B = A – (A ∩ B) is correct.
b) A = (A ∩ B) ∪ (A – B) is correct.
c) A – (B ∩ C) = (A – B) ∪ (A – C) is false.
So, (a) and (b) are true.
Option (d) is the correct answer.
Example 2: Which is the simplified representation of (A’∩ B’∩ C) ∪ (B ∩ C) ∪ (A ∩ C)?
(a) A
(b) B
(c) C
(d) X ∩ (A ∪ B ∪ C)
Ans: (c)
(A’∩ B’∩ C) = only C
(A’∩ B’ ∩ C) ∪ (B ∩ C) ∪ (A ∩ C) = C (by Venn Diagram)
Example 3: In a class of 25 students, 12 students took singing, 11 took dancing, and 15 took writing; 4 took both singing and dancing; 9 took dancing and writing; 5 took writing and singing. 3 took all three. Find the number of students who took
- Singing only
- Dancing only
- Writing only
- Singing and dancing but not writing
- Writing and dancing but not singing
- At least one of the three
- None of the three
Ans:
Let the number of students in the respective regions be represented by a, b, c, d, e, f, and g, as shown above.As per the question given, the data area + b + c + d = 12
b + c + e + f = 11
c + d + f + g = 15
b + c = 4
c + f = 9
c + d = 5
c = 3
By following these equations, we get
c = 3; f = 6; d = 2; b = 1
Now,
c + d + f + g = 15 ⇒ 3 + 2 + 6 + g = 15 ⇒ g = 4
b + c + e + f = 11 ⇒ 1 + 3 + e + 6 = 11 ⇒ e = 1
a + b + c + d = 12 ⇒ a + 1 + 3 + 2 = 12 ⇒ a = 6
So, we have
Number of students who took singing only (a) = 6
Number of students who took dancing only (e) = 1
Number of students who took writing only (g) = 4
Number of students who took singing and dancing but not writing = 1
Number of students who took singing and writing but not dancing = 2
Number of students who took none = (25 – 23) = 2
Number of students who took only one = 6 + 1 + 4 = 11
Number of students who took at least one of the given options = 6 + 1 + 3 + 2 + 1 + 6 + 4 = 23
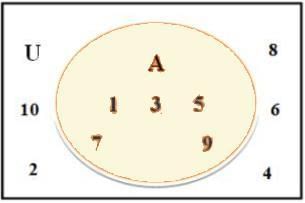
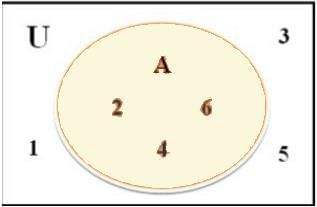
Example 4:Represent the Universal Set (U) = {x : x is an outcome of a dice’s roll} and set A = {s : s ϵ Even numbers} through a Venn diagram.
Sol:Since, U = {1, 2, 3, 4, 5, 6} and A = {2, 4, 6}. Representing this with a Venn diagram we have:
Here, A is a subset of U, represented as – A ⊂ U or
U is the superset of A, represented as – U⊃ A
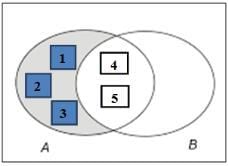
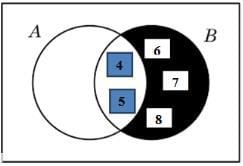
If A = {1, 2, 3, 4, 5} and B = {4, 5, 6, 7, 8},
then represent A – B and B – A through Venn diagrams.
A – B = {1, 2, 3}
B – A = {6, 7, 8}
Representing them in Venn diagrams:a. A-B
b. B-A
|
181 videos|58 docs
|
FAQs on Venn Diagrams and Operations on Sets - Algebra - Mathematics
| 1. What is a Venn Diagram and how is it used in set theory? |  |
| 2. How do you represent the union of two sets using a Venn Diagram? | |
| 3. What does the intersection of two sets mean in a Venn Diagram? | |
| 4. How can you determine if two sets are disjoint using a Venn Diagram? | |
| 5. What are the differences between subsets and proper subsets in the context of Venn Diagrams? | |


ppt
,Extra Questions
,Free
,video lectures
,practice quizzes
,Exam
,Venn Diagrams and Operations on Sets | Algebra - Mathematics
,study material
,Sample Paper
,Viva Questions
,past year papers
,Venn Diagrams and Operations on Sets | Algebra - Mathematics
,Important questions
,shortcuts and tricks
,Objective type Questions
,mock tests for examination
,Venn Diagrams and Operations on Sets | Algebra - Mathematics
,Summary
,Previous Year Questions with Solutions
,MCQs
,Semester Notes
;


Venn Diagrams and Operations on Sets Free PDF Download
Importance of Venn Diagrams and Operations on Sets
Venn Diagrams and Operations on Sets Notes
Venn Diagrams and Operations on Sets Mathematics Questions
Study Venn Diagrams and Operations on Sets on the App
|
© EduRev
|
Education Revolution
|


|


within 7 days!