Data to Statistics | Additional Topics for IIT JAM Mathematics PDF Download
Data:-
Data can be defined as groups of information that represent the qualitative or quantitative attributes of a variable or set of variables, which is the same as saying that data can be any set of information that describes a given entity. Data in statistics can be classified into grouped data and ungrouped data.
Any data that you first gather is ungrouped data. Ungrouped data is data in the raw. An example of ungrouped data is a any list of numbers that you can think of.
Grouped Data:-
Grouped data is data that has been organized into groups known as classes. Grouped data has been 'classified' and thus some level of data analysis has taken place, which means that the data is no longer raw.
A data class is group of data which is related by some user defined property. For example, if you were collecting the ages of the people you met as you walked down the street, you could group them into classes as those in their teens, twenties, thirties, forties and so on. Each of those groups is called a class.
Each of those classes is of a certain width and this is referred to as the Class Interval or Class Size. This class interval is very important when it comes to drawing Histograms and Frequency diagrams. All the classes may have the same class size or they may have different classes sizes depending on how you group your data. The class interval is always a whole number.
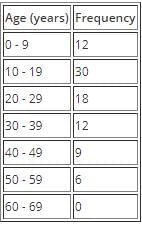
Below is an example of grouped data where the classes have the same class interval.
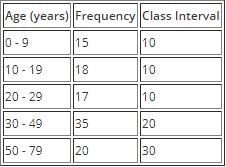
Solution: Below is an example of grouped data where the classes have different class interval. 
Calculating Class Interval:-
Given a set of raw or ungrouped data, how would you group that data into suitable classes that are easy to work with and at the same time meaningful?
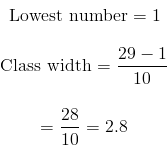
The first step is to determine how many classes you want to have. Next, you subtract the lowest value in the data set from the highest value in the data set and then you divide by the number of classes that you want to have:
Example 1: Group the following raw data into ten classes.
Highest Number = 29
Solution: The first step is to identify the highest and lowest number
Class interval should always be a whole number and yet in this case we have a decimal number. The solution to this problem is to round off to the nearest whole number.
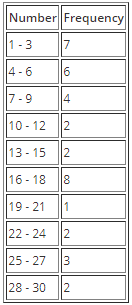
In this example, 2.8 gets rounded up to 3. So now our class width will be 3; meaning that we group the above data into groups of 3 as in the table below.
Class Limits and Class Boundaries:-
Class limits refer to the actual values that you see in the table. Taking an example of the table above, 1 and 3 would be the class limits of the first class. Class limits are divided into two categories: lower class limit and upper class limit. In the table above, for the first class, 1 is the lower class limit while 3 is the upper class limit.
On the other hand, class boundaries are not always observed in the frequency table. Class boundaries give the true class interval, and similar to class limits, are also divided into lower and upper class boundaries.
The relationship between the class boundaries and the class interval is given as follows:
Class Interval = Upper Class Boundary - Lower class Boundary
Class boundaries are related to class limits by the given relationships:
Upper Class Boundary = Upper Class Boundary + 0.5
Lower class Boundary = Lower class Limit - 0.5
As a result of the above, the lower class boundary of one class is equal to the upper class boundary of the previous class.
Class limits and class boundaries play separate roles when it comes to representing statistical data diagrammatically as we shall see in a moment.
|
2 videos|45 docs|4 tests
|


