Cumulative Frequency, Quartiles and Percentiles to Statistics | Additional Topics for IIT JAM Mathematics PDF Download
Cumulative Frequency:-
Cumulative frequency is defined as a running total of frequencies. The frequency of an element in a set refers to how many of that element there are in the set. Cumulative frequency can also defined as the sum of all previous frequencies up to the current point.
The cumulative frequency is important when analyzing data, where the value of the cumulative frequency indicates the number of elements in the data set that lie below the current value. The cumulative frequency is also useful when representing data using diagrams like histograms.
Cumulative Frequency Table
The cumulative frequency is usually observed by constructing a cumulative frequency table. The cumulative frequency table takes the form as in the example below.
Example 1: The set of data below shows the ages of participants in a certain summer camp. Draw a cumulative frequency table for the data.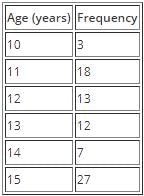
Solution: The cumulative frequency at a certain point is found by adding the frequency at the present point to the cumulative frequency of the previous point.
The cumulative frequency for the first data point is the same as its frequency since there is no cumulative frequency before it.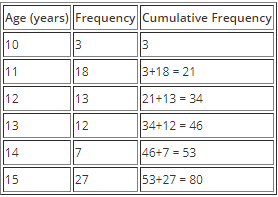
Cumulative Frequency Graph (Ogive):-
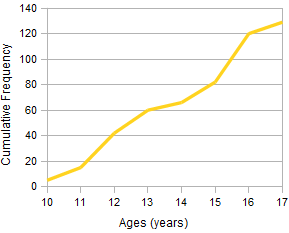
A cumulative frequency graph, also known as an Ogive, is a curve showing the cumulative frequency for a given set of data. The cumulative frequency is plotted on the y-axis against the data which is on the x-axis for un-grouped data. When dealing with grouped data, the Ogive is formed by plotting the cumulative frequency against the upper boundary of the class. An Ogive is used to study the growth rate of data as it shows the accumulation of frequency and hence its growth rate.
Example 2: Plot the cumulative frequency curve for the data set below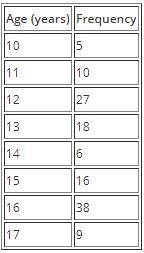
Solution: 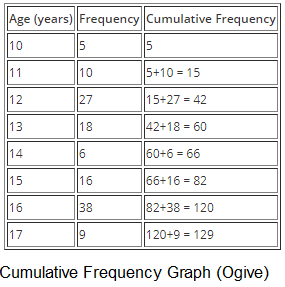
Percentiles:- A percentile is a certain percentage of a set of data. Percentiles are used to observe how many of a given set of data fall within a certain percentage range; for example; a thirtieth percentile indicates data that lies the 13% mark of the entire data set.
Calculating Percentiles
Let designate a percentile as Pm where m represents the percentile we're finding, for example for the tenth percentile, m} would be 10. Given that the total number of elements in the data set is N
Quartiles:- The term quartile is derived from the word quarter which means one fourth of something. Thus a quartile is a certain fourth of a data set. When you arrange a date set increasing order from the lowest to the highest, then you divide this data into groups of four, you end up with quartiles. There are three quartiles that are studied in statistics.
- First Quartile (Q1)
When you arrange a data set in increasing order from the lowest to the highest, then you proceed to divide this data into four groups, the data at the lower fourth (1⁄4) mark of the data is referred to as the First Quartile.
The First Quartile is equal to the data at the 25th percentile of the data. The first quartile can also be obtained using the Ogive whereby you section off the curve into four parts and then the data that lies on the last quadrant is referred to as the first quartile. - Second Quartile (Q2)
When you arrange a given data set in increasing order from the lowest to the highest and then divide this data into four groups , the data value at the second fourth (2⁄4) mark of the data is referred to as the Second Quartile.
This is the equivalent to the data value at the half way point of all the data and is also equal to the the data value at the 50th percentile.
The Second Quartile can similarly be obtained from an Ogive by sectioning off the curve into four and the data that lies at the second quadrant mark is then referred to as the second data. In other words, all the data at the half way line on the cumulative frequency curve is the second quartile. The second quartile is also equal to the median. - Third Quartile (Q3)
When you arrange a given data set in increasing order from the lowest to the highest and then divide this data into four groups, the data value at the third fourth (3⁄4) mark of the data is referred to as the Third Quartile.
This is the equivalent of the the data at the 75th percentile. The third quartile can be obtained from an Ogive by dividing the curve into four and then considering all the data value that lies at the 3⁄4 mark.
Calculating the Different Quartiles
The different quartiles can be calculated using the same method as with the median.
- First Quartile
The first quartile can be calculated by first arranging the data in an ordered list, then finding then dividing the data into two groups. If the total number of elements in the data set is odd, you exclude the median (the element in the middle).
After this you only look at the lower half of the data and then find the median for this new subset of data using the method for finding median described in the section on averages.
This median will be your First Quartile. - Second Quartile
The second quartile is the same as the median and can thus be found using the same methods for finding median described in the section on averages. - Third Quartile
The third quartile is found in a similar manner to the first quartile. The difference here is that after dividing the data into two groups, instead of considering the data in the lower half, you consider the data in the upper half and then you proceed to find the Median of this subset of data using the methods described in the section on Averages.
This median will be your Third Quartile.
Calculating Quartiles from Cumulative Frequency
As mentioned above, we can obtain the different quartiles from the Ogive, which means that we use the cumulative frequency to calculate the quartile.
Given that the cumulative frequency for the last element in the data set is given as fc, the quartiles can be calculated as follows: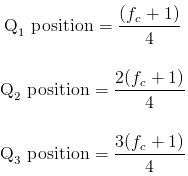
The quartile is then located by matching up which element has the cumulative frequency corresponding to the position obtained above.
Example 3: Find the First, Second and Third Quartiles of the data set below using the cumulative frequency curve.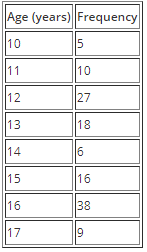
Solution: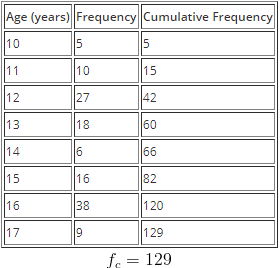
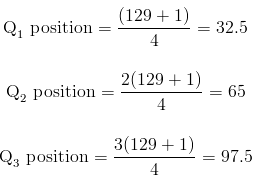
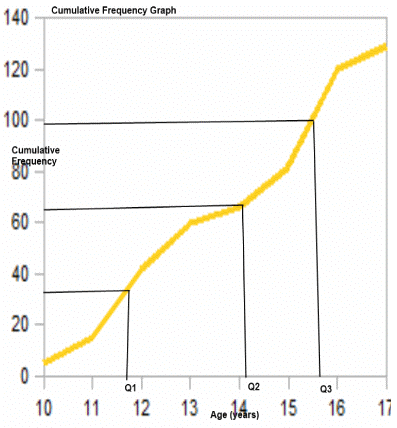
From the Ogive, we can see the positions where the quartiles lie and thus can approximate them as follows
Q1 = 11.5
Q2 = 14.5
Q3 = 15.5
Interquartile Range:- The interquartile range is the difference between the third quartile and the first quartile.
Interquartile range = Q3 - Q1
|
2 videos|44 docs|4 tests
|
FAQs on Cumulative Frequency, Quartiles and Percentiles to Statistics - Additional Topics for IIT JAM Mathematics
| 1. What is cumulative frequency? |  |
| 2. How can quartiles be used in statistics? |  |
| 3. What is the significance of percentiles in statistics? |  |
| 4. How to interpret cumulative frequency graphs? |  |
| 5. Can cumulative frequency be used to calculate the median? |  |


