Civil Engineering (CE) Exam  >  Civil Engineering (CE) Notes  >  Structural Analysis  >  Past Year Questions: Influence Line Diagram & Rolling Loads

Past Year Questions: Influence Line Diagram & Rolling Loads | Structural Analysis - Civil Engineering (CE) PDF Download

Q1: The horizontal beam PQRS shown in the figure has a fixed support at point P, an internal hinge at point Q, and a pin support at point R. A concentrated vertically downward load (V) of 10kN can act at any point over the entire length of the beam.Past Year Questions: Influence Line Diagram & Rolling Loads | Structural Analysis - Civil Engineering (CE)
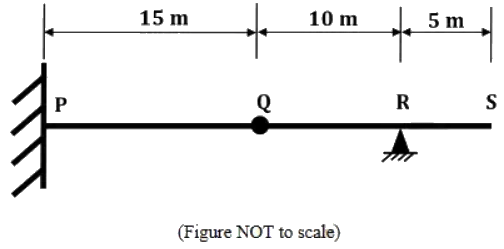
The maximum magnitude of the moment reaction (in kN.m ) that can act at the support P due to V is ______ (in integer).    [2024, Set-2]
Ans: 
150
Sol: Beam is determinate
ILD for BM at 'P' is given by
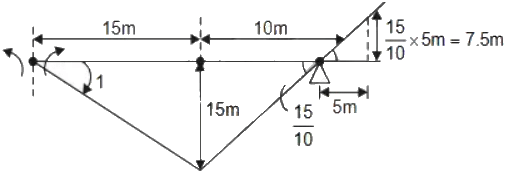
Past Year Questions: Influence Line Diagram & Rolling Loads | Structural Analysis - Civil Engineering (CE)Hence when point load is at 'Q' , the point of max ordinate for ILD for BM at P,BM at P will be max.
⇒ Mp max = 10 x 15 = 150 kN - m


Q1: Muller-Breslau principle is used in analysis of structures for    [2023, Set-2]
(a) drawing an influence line diagram for any force response in the structure
(b) writing the virtual work expression to get the equilibrium equation
(c) superposing the load effects to get the total force response in the structure
(d) relating the deflection between two points in a member with the curvature diagram in between

Ans: (a)
Sol: 
Muller Breslass principle is used to draw influence line diagram for determinate and indeterminate structures. It states that influence line for any stress function may be obtained by removing the restraint offered by that function and introducing a directly related generalised unit displacement at that location in the direction of the stress function.


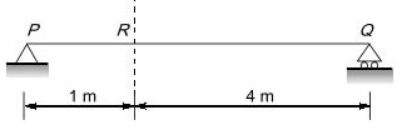
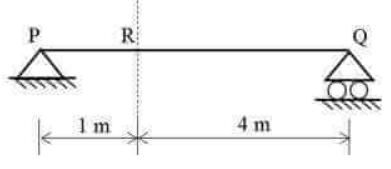
Q1: Consider a simply supported beam PQ as shown in the figure. A truck having 100 kN on the front axle and 200 kN on the rear axle, moves from left to right. The spacing between the axles is 3 m. The maximum bending moment at point R is ______ kNm. (in integer)    [2022, Set-1]
Past Year Questions: Influence Line Diagram & Rolling Loads | Structural Analysis - Civil Engineering (CE)Ans:180
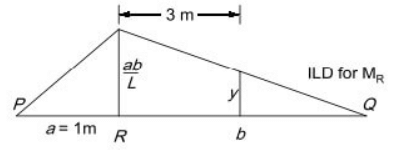
Sol:
Past Year Questions: Influence Line Diagram & Rolling Loads | Structural Analysis - Civil Engineering (CE)Past Year Questions: Influence Line Diagram & Rolling Loads | Structural Analysis - Civil Engineering (CE)Past Year Questions: Influence Line Diagram & Rolling Loads | Structural Analysis - Civil Engineering (CE)

Past Year Questions: Influence Line Diagram & Rolling Loads | Structural Analysis - Civil Engineering (CE)
To get maximum BN at R
Past Year Questions: Influence Line Diagram & Rolling Loads | Structural Analysis - Civil Engineering (CE)


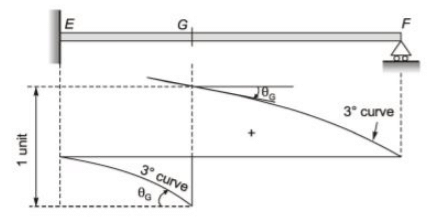
Q1: A propped cantilever beam EF is subjected to a unit moving load as shown in the figure (not to scale). The sign convention for positive shear force at the left and right sides of any section is also shown.    [2021, Set-1]
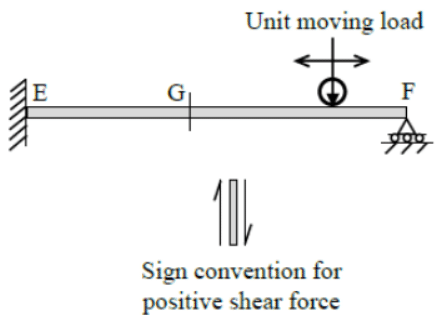
Past Year Questions: Influence Line Diagram & Rolling Loads | Structural Analysis - Civil Engineering (CE)The CORRECT qualitative nature of the influence line diagram for shear force at G is
(a) Past Year Questions: Influence Line Diagram & Rolling Loads | Structural Analysis - Civil Engineering (CE)
(b)Past Year Questions: Influence Line Diagram & Rolling Loads | Structural Analysis - Civil Engineering (CE)
(c)Past Year Questions: Influence Line Diagram & Rolling Loads | Structural Analysis - Civil Engineering (CE)
(d)Past Year Questions: Influence Line Diagram & Rolling Loads | Structural Analysis - Civil Engineering (CE)

Ans: (b)
Sol:

Past Year Questions: Influence Line Diagram & Rolling Loads | Structural Analysis - Civil Engineering (CE)

As per Muller Breslau principle ILD for stress function (shear−VG) will be a combination of curves (3 curves).


Q1: Distributed load(s) of 50 kN/m may occupy any position(s) (either continuously or in patches) on the girder PQRST as shown in the figure    [2020, Set-1]
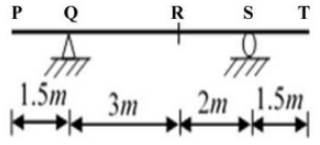
Past Year Questions: Influence Line Diagram & Rolling Loads | Structural Analysis - Civil Engineering (CE)The maximum negative (hogging) bending moment (in kNm) that occurs at point R, is
(a) 22.5
(b) 56.25
(c) 93.75
(d) 150
Ans:
(b)
Sol:Past Year Questions: Influence Line Diagram & Rolling Loads | Structural Analysis - Civil Engineering (CE)
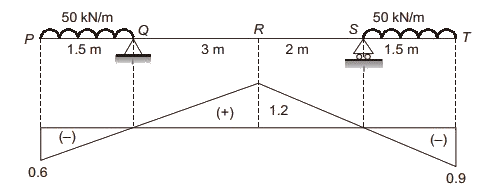
ILD for BM at R:
To get maximum hogging BM at R, keep UDL over PQ and ST.
Past Year Questions: Influence Line Diagram & Rolling Loads | Structural Analysis - Civil Engineering (CE)
= 56.25 kNm


Q1: A long uniformly distributed load of 10 kN/m and a concentrated load of 60 kN are moving together on the beam ABCD shows in the figure (not drawn to scale). The relative positions of the two loads are not fixed. The maximum shear force (in kN, round off to the nearest integer) caused at the internal hinge B due to the two loads is______    [2019, Set-2]
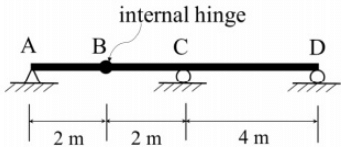
Past Year Questions: Influence Line Diagram & Rolling Loads | Structural Analysis - Civil Engineering (CE)

Ans: 70
Sol: ILD for VB

Past Year Questions: Influence Line Diagram & Rolling Loads | Structural Analysis - Civil Engineering (CE)

Past Year Questions: Influence Line Diagram & Rolling Loads | Structural Analysis - Civil Engineering (CE)


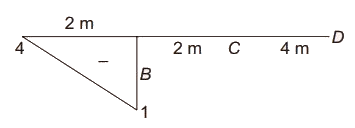
Q2: Consider the beam ABCD shown in the figure
Past Year Questions: Influence Line Diagram & Rolling Loads | Structural Analysis - Civil Engineering (CE)
For a moving concentrated load of 50 kN on the beam, the magnitude of the maximum bending moment (in kN-m) obtained at the support C will be equal to _________ .    [2017 : 2 Marks, Set-I]
Solution:

Past Year Questions: Influence Line Diagram & Rolling Loads | Structural Analysis - Civil Engineering (CE)

ILD for BM at C

Past Year Questions: Influence Line Diagram & Rolling Loads | Structural Analysis - Civil Engineering (CE)

Max. BM occurs at C, when 50 kN load is at B.

Max. BM at C = 50 x (-4) = -200 kNm

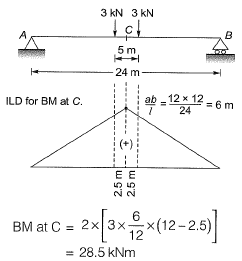
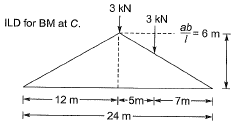
Q.3 A simply supported beam AB of span, L = 24 m is subjected to two wheel loads acting at a distance, d = 5 m apart as shown in the figure below. Each wheel transmits a load, P = 3 kN and may occupy any position along the beam. If the beam is an I-section having section modulus, S=16.2 cm3, the maximum bending stress (in GPa) due to the wheel loads is _________ . [2015 : 2 Marks, Set-II]
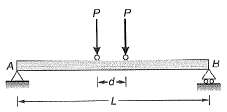
Past Year Questions: Influence Line Diagram & Rolling Loads | Structural Analysis - Civil Engineering (CE)
Solution:
 

Method-1 (By ILD)

C.G. of system = 2.5 m from any load

For maximum bending moment, system of load should be,
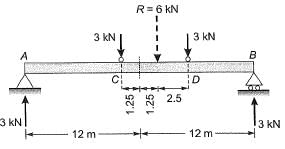
Past Year Questions: Influence Line Diagram & Rolling Loads | Structural Analysis - Civil Engineering (CE)

Past Year Questions: Influence Line Diagram & Rolling Loads | Structural Analysis - Civil Engineering (CE)

Maximum BM will occur below load at C. Ordinate of ILD at C
Past Year Questions: Influence Line Diagram & Rolling Loads | Structural Analysis - Civil Engineering (CE)
Ordinate of ILD at D
Past Year Questions: Influence Line Diagram & Rolling Loads | Structural Analysis - Civil Engineering (CE)
Maximum BM = 5.935 x 3 + 3.695 x 3
= 28.89 kN-m
Maximum bending stress,
Past Year Questions: Influence Line Diagram & Rolling Loads | Structural Analysis - Civil Engineering (CE)
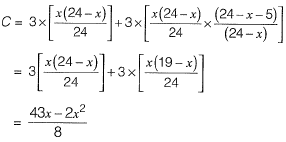
Method-II  (By Statics)
Let the section at which absolute max. BM ocurs be at x distance from left support.
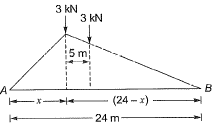
Past Year Questions: Influence Line Diagram & Rolling Loads | Structural Analysis - Civil Engineering (CE)
Max. BM at section
Past Year Questions: Influence Line Diagram & Rolling Loads | Structural Analysis - Civil Engineering (CE)
For absolute max. BM,
Past Year Questions: Influence Line Diagram & Rolling Loads | Structural Analysis - Civil Engineering (CE)
⇒ x = 10.75 m
Absolute max BM
Past Year Questions: Influence Line Diagram & Rolling Loads | Structural Analysis - Civil Engineering (CE)
Absolute max bending stress
Past Year Questions: Influence Line Diagram & Rolling Loads | Structural Analysis - Civil Engineering (CE)
AVOID MISTAK
(I)
Past Year Questions: Influence Line Diagram & Rolling Loads | Structural Analysis - Civil Engineering (CE)
Max. bending stress
Past Year Questions: Influence Line Diagram & Rolling Loads | Structural Analysis - Civil Engineering (CE)
(II)
Past Year Questions: Influence Line Diagram & Rolling Loads | Structural Analysis - Civil Engineering (CE)
Max. bending stress
Past Year Questions: Influence Line Diagram & Rolling Loads | Structural Analysis - Civil Engineering (CE)
This is the maximum bending stress at mid= span and not the absolute max. bending stress in the beam.

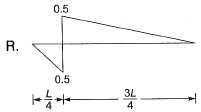
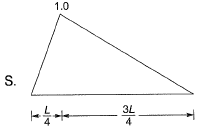
Q.4 In a beam of length L, four possible influence line diagrams for shear force at a section located at a distance of L/4  from the left end support (marked as P, Q, R and S) are shown below. The correct influence line diagram is    [2014 : 1 Mark, Set-I]
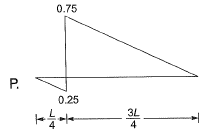
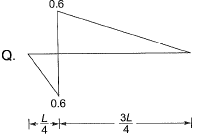
Past Year Questions: Influence Line Diagram & Rolling Loads | Structural Analysis - Civil Engineering (CE)
(a) P
(b) Q
(c) R
(d) S
Ans.
(A)
Solution:
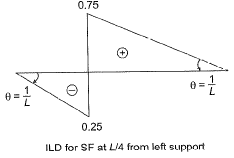
Past Year Questions: Influence Line Diagram & Rolling Loads | Structural Analysis - Civil Engineering (CE)

Q.5 Beam PQRS has internal hinges in spans in spans PQ and RS as shown. The beam may be subjected to a moving distributed vertical load of maximum intensity 4 kN/m of any length anywhere on the beam. The maximum absolute value of the shear force (in kN) that can occur due to this loading just to the right of support Q shall be   [2013 : 2 Marks]
Past Year Questions: Influence Line Diagram & Rolling Loads | Structural Analysis - Civil Engineering (CE)
(a) 30 kN
(b) 40 kN
(c) 45 kN
(d) 55 kN
Ans.
(C)
Solution:
Drawing the ILD of shear force just to right of Q by using Muller Breslau’s principle. A cut is made just to the right of Q, since cut is very close to support Q, therefore displacement of left portion is almost zero and that to the right portion will be 1.
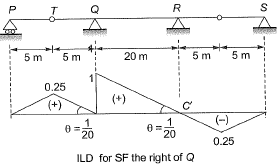
Past Year Questions: Influence Line Diagram & Rolling Loads | Structural Analysis - Civil Engineering (CE)
If moving distributed load is present over span PR then we get maximum shear force just to the right of Q.
Past Year Questions: Influence Line Diagram & Rolling Loads | Structural Analysis - Civil Engineering (CE)

The document Past Year Questions: Influence Line Diagram & Rolling Loads | Structural Analysis - Civil Engineering (CE) is a part of the Civil Engineering (CE) Course Structural Analysis.
All you need of Civil Engineering (CE) at this link: Civil Engineering (CE)
34 videos|140 docs|31 tests

Top Courses for Civil Engineering (CE)

FAQs on Past Year Questions: Influence Line Diagram & Rolling Loads - Structural Analysis - Civil Engineering (CE)

1. What is an influence line diagram in civil engineering?
Ans. An influence line diagram is a graphical representation used in civil engineering to determine the effect of a moving load on a structure, such as a beam or a bridge. It shows the variation of a specific response, such as shear force or bending moment, at different points along the structure as the load moves. The diagram helps engineers analyze and design structures to ensure their safety and efficiency.
2. How is an influence line diagram constructed?
Ans. To construct an influence line diagram, one must consider the position of the moving load and the response being analyzed. The load is placed at different positions along the structure, and the corresponding effect on the response is determined. By plotting these effects at various positions, a line diagram is formed, representing the influence of the load on the response. The diagram can be further analyzed to determine the maximum and minimum values of the response and their locations.
3. What are the applications of influence line diagrams in civil engineering?
Ans. Influence line diagrams have various applications in civil engineering. They are used to determine the maximum and minimum values of forces and moments in structures, such as beams and bridges, due to moving loads. This information is crucial for designing and assessing the structural integrity and safety of these elements. Influence line diagrams also aid in optimizing the design of structures, as they provide engineers with a visual representation of load effects, allowing for efficient load distribution and material usage.
4. How are rolling loads considered in influence line diagrams?
Ans. Rolling loads, such as those caused by trains or vehicles, are considered in influence line diagrams by analyzing the effect of the load as it moves along the structure. The position of the load is systematically varied, and the resulting effect on the response, such as shear force or bending moment, is determined at each position. By plotting these effects, engineers can obtain the influence line diagram, which represents the response to rolling loads at different points along the structure.
5. Can influence line diagrams be used for structures other than beams and bridges?
Ans. Yes, influence line diagrams can be used for structures other than beams and bridges. While they are most commonly used for these types of structures, the concept of influence lines can be applied to other elements as well, such as columns or trusses. The analysis and design principles behind influence line diagrams remain the same, with the diagram representing the effect of a moving load at different positions along the structure. However, the specific response being analyzed may differ depending on the type of structure.
34 videos|140 docs|31 tests
Download as PDF
Explore Courses for Civil Engineering (CE) exam

Top Courses for Civil Engineering (CE)

Signup for Free!
Signup to see your scores go up within 7 days! Learn & Practice with 1000+ FREE Notes, Videos & Tests.
10M+ students study on EduRev
Related Searches

ppt

,

Objective type Questions

,

Summary

,

pdf

,

shortcuts and tricks

,

Exam

,

Important questions

,

Past Year Questions: Influence Line Diagram & Rolling Loads | Structural Analysis - Civil Engineering (CE)

,

Semester Notes

,

Extra Questions

,

Free

,

Sample Paper

,

video lectures

,

practice quizzes

,

past year papers

,

Previous Year Questions with Solutions

,

mock tests for examination

,

Past Year Questions: Influence Line Diagram & Rolling Loads | Structural Analysis - Civil Engineering (CE)

,

MCQs

,

Past Year Questions: Influence Line Diagram & Rolling Loads | Structural Analysis - Civil Engineering (CE)

,

Viva Questions

,

study material

;