Past Year Questions: Traffic Engineering - 2 | Transportation Engineering - Civil Engineering (CE) PDF Download

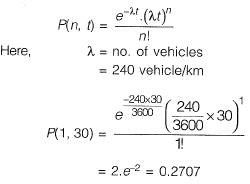
Question 1. An observer counts 240 veh/h at a specific highway location. Assume that the vehicle arrival at the location is Poisson distributed, the probability of having one vehicle arriving over a 30-second time interval is _______ . [2014 : 2 Marks, Set-II]
Solution:
Question 2. The average spacing between vehicles in a traffic stream is 50 m, then the density (in veh/km) of the stream is __________ . [2014 : 1 Mark, Set-II]
Solution: 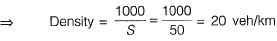
Question 3. An isolated three-phase traffic signal is designed by Webster's method. The critical flow ratios for three phases are 0.20,0.30, and 0.25 respectively and lost time per phase is 4 seconds. The optimum cycle length (in seconds) is ___________ . [2014 : 2 Marks, Set-I]
Solution: Sum of the flow,
y = y1 + y2 + y3
= 0.2 + 0.3 + 0.25 = 0.75
Total lost time in a cycle L = 4 x 3 = 12 sec.
Optimum cycle length,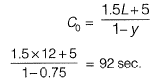
Question 4. The speed-density (u-k) relationship on a single lane road with unidirectional flow is u = 70-0.7 k, where u is in km/hr and k is in veh/km. The capacity of the road (in veh/hr) i s ___________ . [2014 : 2 Marks, Set-I]
Solution:
Method-I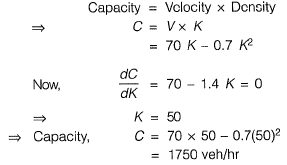
Method-II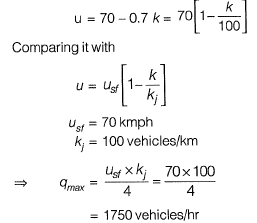
Question 5. The minimum value of 15 minute peak hour factor on a section of a road is [2014 : 1 Mark, Set-I]
(a) 0.10
(b) 0.20
(c) 0.25
(d) 0.33
Answer: (c)
Solution:
Method-I
15 min. peak hr factor is used for traffic intersection design,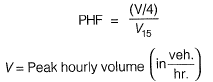
V15 = Maximum 15 minute volume within the peak hr. (veh.)
Maximum value is 1.0 and minimum value is 0.25 Normal range is 0.7 - 0.98
Method-I
Consider a peak hour with total traffic V.
Let the traffic be divided as such,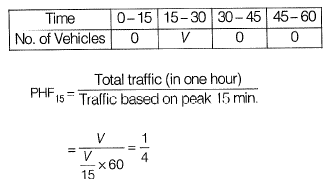
Question 6. For two major-roads with divided carriage way crossing at right angle, a full clover leaf interchange with four indirect ramps is provided. Following statements are made on turning movement of vehicles to all direction from both road, identity the correct statement. [2013 : 1 Mark]
(a) Merging from left is not possible, but diverging to left not possible.
(b) Merging from left and diverging to left is possible.
(c) Merging from left is possible but diverging is not possible.
(d) Neither merging from left nor diverging to left is possible.
Answer: (b)
Solution:Merging from left is done using a clover left and diverging to left is done using indirect ramp.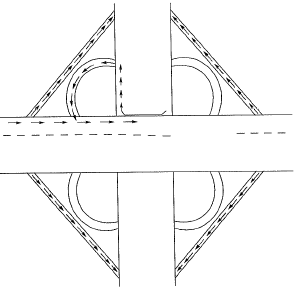
Question 7. It was observed that 150 vehicle crossed a particular location of highway in 30 minutes. Assume that vehicle arrival follow a negative exponential distribution. The number of time headways greater than 5 sec. in above observation is [2013 : 1 Mark]
Solution:
Where, P(x) is the probability of x events (vehicle arrivals) in some time interval (t).
X is the mean arrival rate in that interval.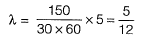
Now, the probability that zero vehicle arrive in an interval t, denoted as P(0), will be same as the probability that the headway (into arrival time) greater than or equal to t.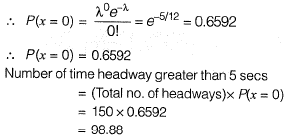
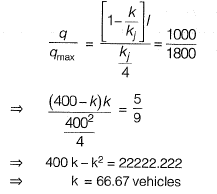
Question 8. A two-lane urban road with one-way traffic has a maximum capacity of 1800 vehicles/hour. Under the jam condition, the average length occupied by the vehicles is 5.0 m. The speed versus density relationship is linear. For a traffic volume of 1000 vehicles/hour, the density (in vehicles/km) is [2012 : 2 Marks]
(a) 52
(b) 58
(c) 67
(d) 75
Answer: (c)
Solution:
Method-II
Capacity per lane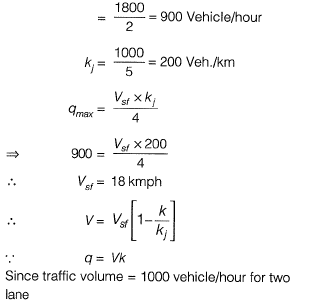
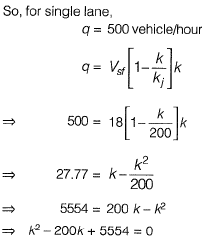
∴ k = 33.32 Veh./km (for single lane)
So, for two lane urban road,
k = 33.32 x 2 = 66.64 ∼ 67
Method-II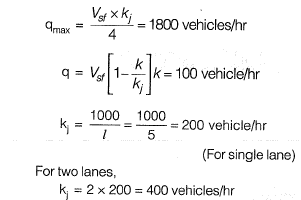
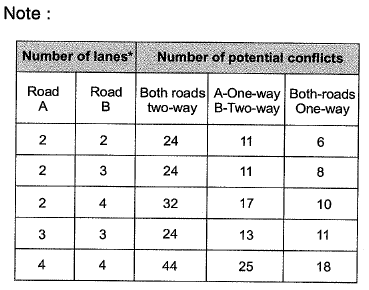
Question 9. Two major roads with two lanes each are crossing in an urban areas to form an un-controlied intersection. The number of conflict points when both roads are one way is “X' and when both roads are two-way is “ Y'. The ratio of X to Y is [2012 : 1 Mark]
(a) 0.25
(b) 0.33
(c) 0.50
(d) 0.75
Answer: (a)
Solution: When both roads are one-way then total no. of conflict points, x = 6
When both roads are two-way then total no . of conflict points, y = 24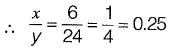
Question 10. The cumulative arrival and departure curve of one cycle of an approach lane of a signalized intersection is shown in the adjoining figure. The cycle time is 50 s and the effective red time is 30s and the effective green time is 20 s. What is the average delay? [2011 : 2 Marks]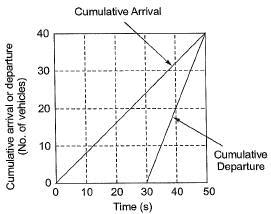
(a) 15 s
(b) 25 s
(c) 35 s
(d) 45 s
Answer: (a)
Solution:
Method-I
Average delay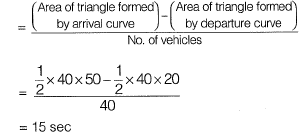
Method-II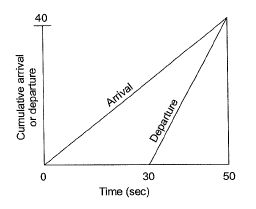
Vehicle 1 arrives at 0 second and departs at 30 seconds.
Vehicle 40 arrivers at 50 seconds and departs at the same time.
Delay for vehicle 1 = 30 second
Delay for vehicle 40 = 0 second
Question 11. If the jam density is given as k- and the free flow speed is given as uf, the maximum flow for a linear traffic speed-density model is given by which of the following options? [2011 : 2 Marks]
(a) 
(b) 
(c) 
(d) 
Answer: (a)
Question 12. The probability that k number of vehicles arrive (i.e. cross a predefined line) in time t is given as (λt) e-λt/k! where λ is the average vehicle arrival rate. What is the probability that the time headway is greater than or equal to time t1? [2011 : 1 Mark]
(a) 
(b) 
(c) 
(d) 
Answer: (d)
Solution: Probability of arriving 'n' number of vehicles in time f,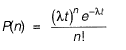
If time headway is greater than or equal to time f, then number of vehicles arriving is zero,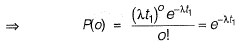
Question 13. As per IRC: 67-2001, a traffic sign indicating the Speed Limit on a road should be of [2010 : 1 Mark]
(a) circular shape with white background and red border
(b) triangular shape with white background and red border
(c) triangular shape with red background and white border
(d) circular shape with red background and white border
Answer: (a)
Solution: Speed limit sign is a regulatory or mandatory sign and should be of circular shape with white background and red border.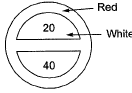
|
27 videos|118 docs|58 tests
|
FAQs on Past Year Questions: Traffic Engineering - 2 - Transportation Engineering - Civil Engineering (CE)
| 1. What is traffic engineering and why is it important? |  |
| 2. What are the key factors considered in traffic engineering? | |
| 3. How is traffic congestion managed in traffic engineering? | |
| 4. How does traffic engineering contribute to road safety? | |
| 5. How does traffic engineering contribute to sustainable transportation? | |


Past Year Questions: Traffic Engineering - 2 | Transportation Engineering - Civil Engineering (CE)
,Past Year Questions: Traffic Engineering - 2 | Transportation Engineering - Civil Engineering (CE)
,Extra Questions
,Exam
,Important questions
,Summary
,past year papers
,shortcuts and tricks
,Previous Year Questions with Solutions
,Viva Questions
,Sample Paper
,study material
,practice quizzes
,mock tests for examination
,Semester Notes
,Past Year Questions: Traffic Engineering - 2 | Transportation Engineering - Civil Engineering (CE)
,video lectures
,ppt
,Objective type Questions
,Free
,MCQs
;


Past Year Questions: Traffic Engineering - 2 Free PDF Download
Importance of Past Year Questions: Traffic Engineering - 2
Past Year Questions: Traffic Engineering - 2 Notes
Past Year Questions: Traffic Engineering - 2 Civil Engineering (CE)
Study Past Year Questions: Traffic Engineering - 2 on the App
|
© EduRev
|
Education Revolution
|


|


