
Best Study Material for Class 10 Exam
Class 10 Exam > Class 10 Notes > Mathematics (Maths) Class 10 > Important Definitions & Formulas: Statistics
Important Definitions & Formulas: Statistics | Mathematics (Maths) Class 10 PDF Download
| Table of contents |
|
| Statistics |
|
| Mean |
|
| Mode |
|
| Median |
|
Statistics
Statistics is a branch of mathematics that focuses on collecting, organising, analysing, interpreting, and presenting data.
Ungrouped Data
Ungrouped data is data in its original or raw form. The observations are not classified into groups.
Example: The ages of everyone present in a classroom of kindergarten kids with the teacher are as follows:
3, 3, 4, 3, 5, 4, 3, 3, 4, 3, 3, 3, 3, 4, 3, 27.
Grouped Data
- Grouped data means that observations are organised into groups.
- This type of data is easier to handle when there is a lot of information.
For example, a class of students got different marks in a school exam. The data is tabulated as follows: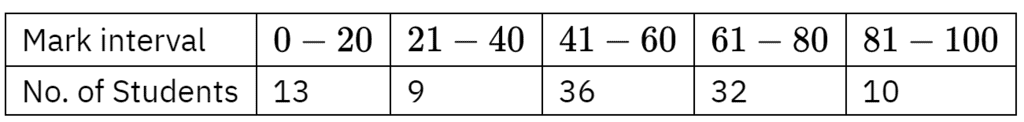 This shows how many students got the particular mark range. Grouped data is easier to work with when a large amount of data is present.
Frequency
- Frequency is the number of times a particular observation occurs in data.
- Example: if four students have scored marks between 90 and 100, then the marks scored between 90 and 100 have a frequency of 4.
Class Interval
- Data can be grouped into class intervals, where all observations within that range belong to that class.
- Class width = upper class limit – lower class limit.
- Example: Consider a class interval 31 – 40.
Here, the lower class limit is 31, and the upper class limit is 40.
Hence, the size/width of the class interval 31 – 40 is calculated as follows:
Class interval size = Upper class limit – Lower class limit
Class interval size = 40 – 31 = 9
Therefore, the size of the class interval is 9.
Mean
 |
Download the notes
Important Definitions & Formulas: Statistics
|
Download as PDF |
Download as PDF
Mean of Grouped Data (Without Class Interval)
If the data is organized in such a way that there is no class interval then we can calculate the mean by 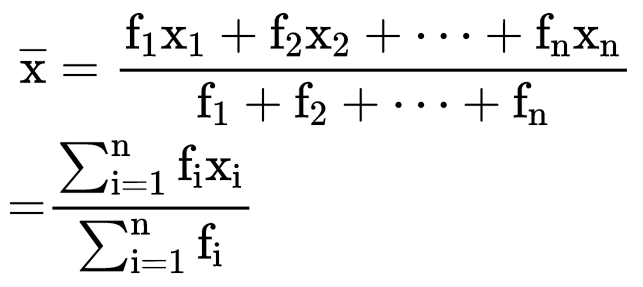 where, x1, x2, x3,...... xn are the observations
f1, f2, f3, ...... fn are the respective frequencies of the given observations.
Example: Calculate mean from the following data.
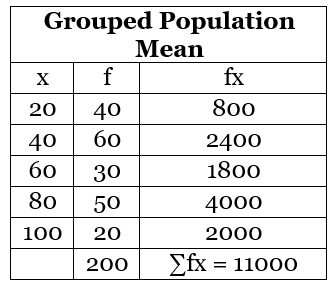
Here, x1, x2, x3, x4, x5 are 20, 40, 60, 80, 100 respectively and f1, f2, f3, f4, f5 are 40, 60, 30, 50, 20 respectively. 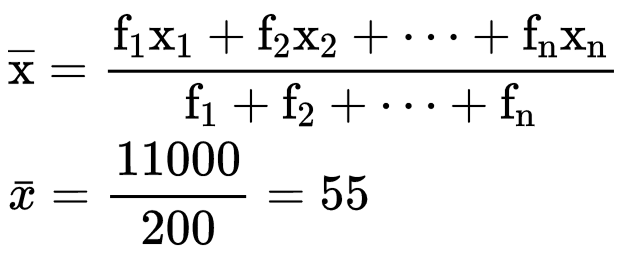
Mean of Grouped Data (With Class-Interval)
When the data is grouped in the form of class interval then the mean can be calculated by three methods.
1. Direct Method
In this method, we use a midpoint which represents the whole class. It is called the class mark. It is the average of the upper limit and the lower limit. 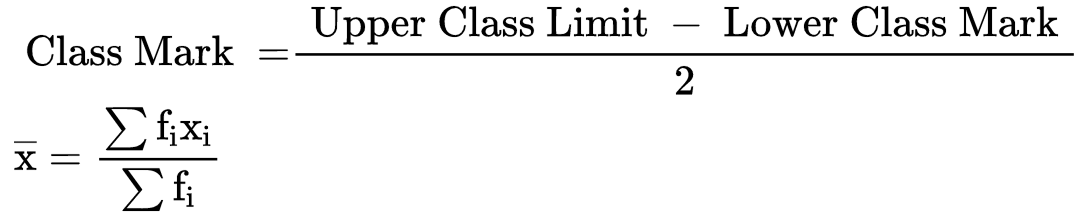 Example: A teacher marks the test result of the class of 55 students for mathematics. Find the mean for the given group.
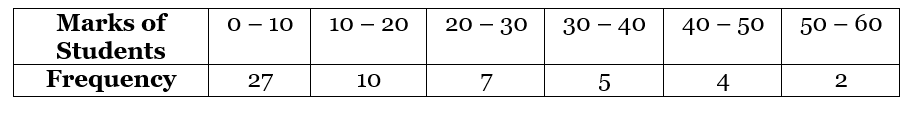
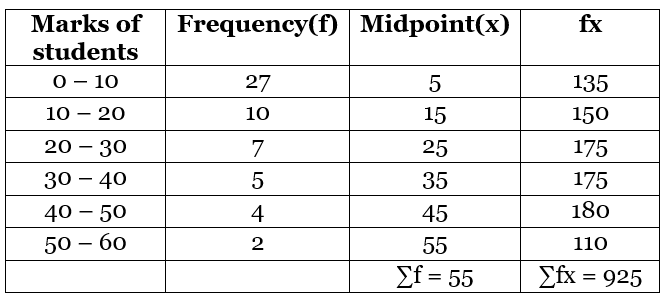
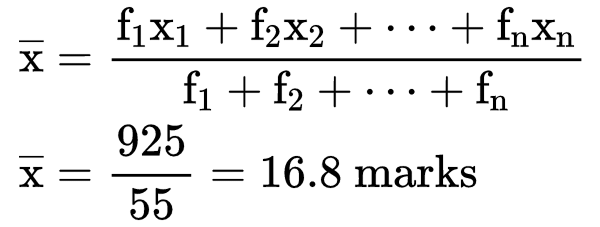
Solution: To find the mean we need to find the mid-point or class mark for each class interval which will be the x and then by multiplying frequency and midpoint we get fx.
2. Deviation or Assumed Mean Method
If we have to calculate the large numbers then we can use this method to make our calculations easy. In this method, we choose one of the x’s as assumed mean and let it as “a”. Then we find the deviation which is the difference of assumed mean and each of the x. The rest of the method is the same as the direct method. 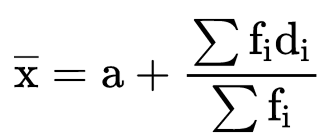
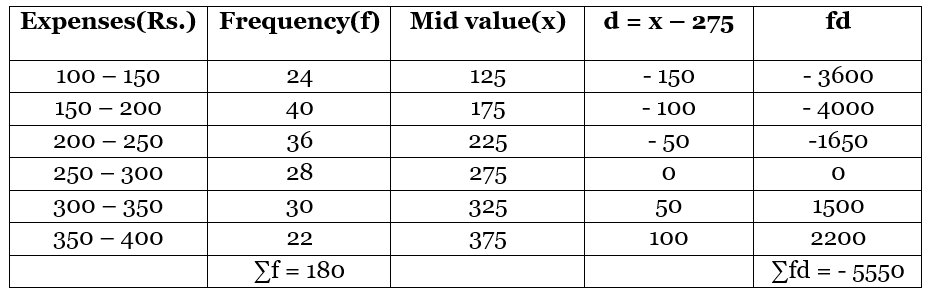
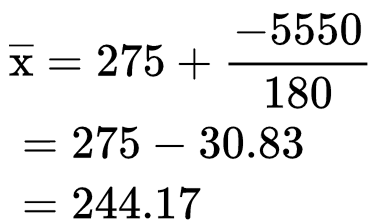
Example: If we have the table of the expenditure of the company's workers in the household, then what will be the mean of their expenses? Solution:
As we can see that there are big values of x to calculate so we will use the assumed mean method.
Here we take 275 as the assumed mean.
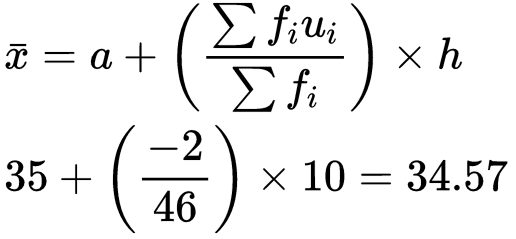
3. Step Deviation Method
In this method, we divide the values of d with a number "h" to make our calculations easier. 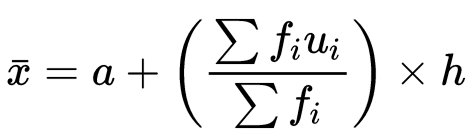
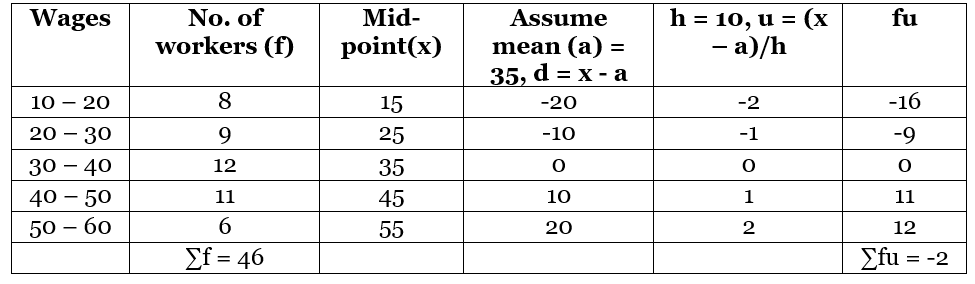
Example: The wages of the workers are given in the table. Find the mean by step deviation method.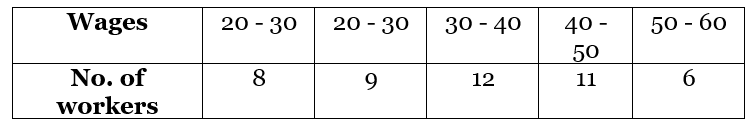 Solution:
 |
Take a Practice Test
Test yourself on topics from Class 10 exam
|
Practice Now |
Practice Now
Mode
In the ungrouped data the most frequently occurring no. is the mode of the sequence, but in the grouped data we can find the class interval only which has the maximum frequency number i.e. the modal class.
The value of mode in that modal class is calculated by 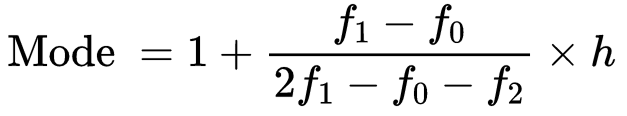 l = lower class limit of the modal class
h = class interval size
f1 =frequency of the modal class
f0 =frequency of the preceding class
f2 = frequency of the succeeding class
Example: The table of the marks of the students of a class is given. Find the modal class and the mode.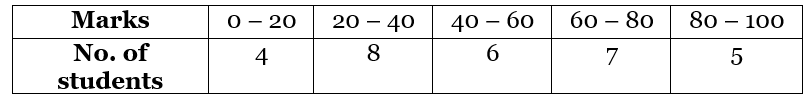 Solution:
Here we can see that the class interval with the highest frequency 8 is 20 – 40.
So this is our modal class.
Modal class = 20 - 40
Lower limit of modal class (l) = 20
Class interval size (h) = 20
Frequency of the modal class(f1) = 8
Frequency of the preceding class(f0) = 4
Frequency of the succeeding class (f2) = 6 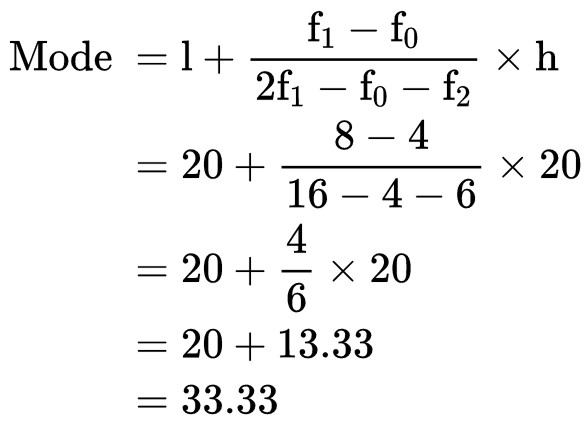
Median
To find the median of a grouped data, we need to find the cumulative frequency and n/2
Then we have to find the median class, which is the class of the cumulative frequency near or greater than the value of n/2.
Cumulative Frequency is calculated by adding the frequencies of all the classes preceding the given class.
Then substitute the values in the formula 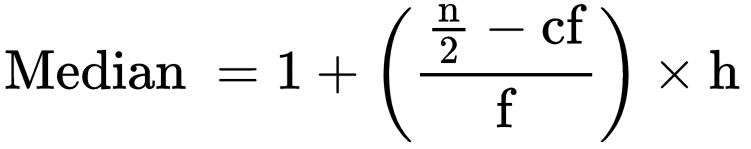 where l = lower limit of median class
n = no. of observations
cf = cumulative frequency of the class preceding to the median class
f = frequency of the median class
h = size of class
Example: Find the median of the given table.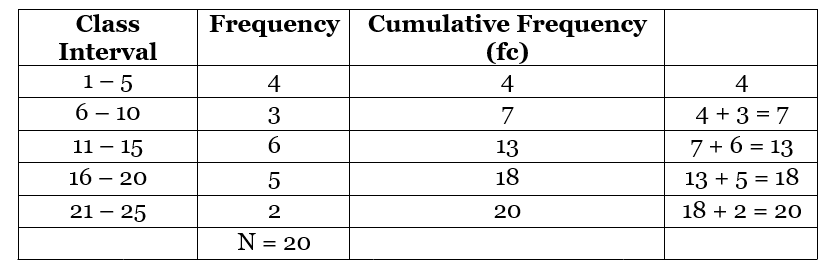 Solution:
Let’s find the n/2.
n = 20, so n/2 = 20/2 = 10
The median class is 11 - 15 as its cumulative frequency is 13 which is greater than 10. 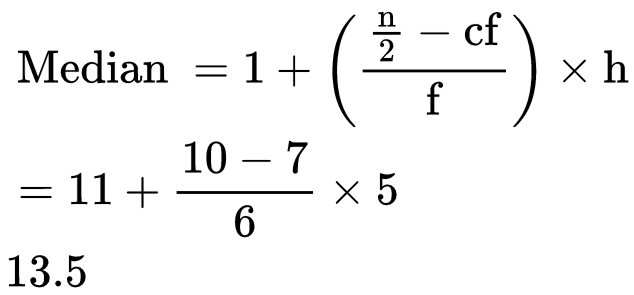 Remark: The empirical relation between the three measures of central tendency is
3 Median = Mode + 2 Mean
The document Important Definitions & Formulas: Statistics | Mathematics (Maths) Class 10 is a part of the Class 10 Course Mathematics (Maths) Class 10.
All you need of Class 10 at this link: Class 10
|
127 videos|550 docs|75 tests
|


FAQs on Important Definitions & Formulas: Statistics - Mathematics (Maths) Class 10
| 1. What is the difference between mean, median, and mode in statistics? |  |
| 2. How do you calculate the mean of a data set? | |
Ans. To calculate the mean, you add together all the numbers in the data set and then divide that total by the number of values. The formula is: Mean = (Sum of all values) / (Number of values).
| 3. When would you use the median instead of the mean? | |
Ans. You would use the median instead of the mean when the data set contains outliers or is skewed. The median is not affected by extreme values, making it a better measure of central tendency for non-symmetric distributions.
| 4. Can a data set have more than one mode? | |
Ans. Yes, a data set can have more than one mode. If multiple values appear with the same highest frequency, the data set is multimodal. If no value repeats, it is called a uniform distribution and has no mode.
| 5. How do you find the mode in a data set? | |
Ans. To find the mode, you count how many times each value appears in the data set. The value that occurs most frequently is the mode. If two or more values occur with the same highest frequency, all of those values are considered modes.
About this Document

2.1K Views

4.69/5
Rating

Mar 16, 2025
Last updated
Document Description: Important Definitions & Formulas: Statistics for Class 10 2025 is part of Mathematics (Maths) Class 10 preparation.
The notes and questions for Important Definitions & Formulas: Statistics have been prepared according to the Class 10 exam syllabus. Information about Important Definitions & Formulas: Statistics covers topics
like Statistics, Mean, Mode, Median and Important Definitions & Formulas: Statistics Example, for Class 10 2025 Exam. Find important definitions, questions, notes, meanings, examples, exercises and tests below for Important Definitions & Formulas: Statistics.
Introduction of Important Definitions & Formulas: Statistics in English is available as part of our Mathematics (Maths) Class 10
for Class 10 & Important Definitions & Formulas: Statistics in Hindi for Mathematics (Maths) Class 10 course.
Download more important topics related with notes, lectures and mock test series for Class 10
Exam by signing up for free. Class 10: Important Definitions & Formulas: Statistics | Mathematics (Maths) Class 10
Description
Full syllabus notes, lecture & questions for Important Definitions & Formulas: Statistics | Mathematics (Maths) Class 10 - Class 10 | Plus excerises question with solution to help you revise complete syllabus for Mathematics (Maths) Class 10 | Best notes, free PDF download
Information about Important Definitions & Formulas: Statistics
In this doc you can find the meaning of Important Definitions & Formulas: Statistics defined & explained in the simplest way possible. Besides explaining types of
Important Definitions & Formulas: Statistics theory, EduRev gives you an ample number of questions to practice Important Definitions & Formulas: Statistics tests, examples and also practice Class 10
tests

Related Searches
video lectures
,mock tests for examination
,Important Definitions & Formulas: Statistics | Mathematics (Maths) Class 10
,Summary
,Extra Questions
,study material
,Sample Paper
,Exam
,shortcuts and tricks
,ppt
,Important questions
,Viva Questions
,practice quizzes
,Semester Notes
,Important Definitions & Formulas: Statistics | Mathematics (Maths) Class 10
,Important Definitions & Formulas: Statistics | Mathematics (Maths) Class 10
,Free
,Objective type Questions
,past year papers
,MCQs
,Previous Year Questions with Solutions
;


Additional Information about Important Definitions & Formulas: Statistics for Class 10 Preparation
Important Definitions & Formulas: Statistics Free PDF Download
The Important Definitions & Formulas: Statistics is an invaluable resource that delves deep into the core of the Class 10 exam.
These study notes are curated by experts and cover all the essential topics and concepts, making your preparation more efficient and effective.
With the help of these notes, you can grasp complex subjects quickly, revise important points easily,
and reinforce your understanding of key concepts. The study notes are presented in a concise and easy-to-understand manner,
allowing you to optimize your learning process. Whether you're looking for best-recommended books, sample papers, study material,
or toppers' notes, this PDF has got you covered. Download the Important Definitions & Formulas: Statistics now and kickstart your journey towards success in the Class 10 exam.
Importance of Important Definitions & Formulas: Statistics
The importance of Important Definitions & Formulas: Statistics cannot be overstated, especially for Class 10 aspirants.
This document holds the key to success in the Class 10 exam.
It offers a detailed understanding of the concept, providing invaluable insights into the topic.
By knowing the concepts well in advance, students can plan their preparation effectively.
Utilize this indispensable guide for a well-rounded preparation and achieve your desired results.
Important Definitions & Formulas: Statistics Notes
Important Definitions & Formulas: Statistics Notes offer in-depth insights into the specific topic to help you master it with ease.
This comprehensive document covers all aspects related to Important Definitions & Formulas: Statistics.
It includes detailed information about the exam syllabus, recommended books, and study materials for a well-rounded preparation.
Practice papers and question papers enable you to assess your progress effectively.
Additionally, the paper analysis provides valuable tips for tackling the exam strategically.
Access to Toppers' notes gives you an edge in understanding complex concepts.
Whether you're a beginner or aiming for advanced proficiency, Important Definitions & Formulas: Statistics Notes on EduRev are your ultimate resource for success.
Important Definitions & Formulas: Statistics Class 10 Questions
The "Important Definitions & Formulas: Statistics Class 10 Questions" guide is a valuable resource for all aspiring students preparing for the
Class 10 exam. It focuses on providing a wide range of practice questions to help students gauge
their understanding of the exam topics. These questions cover the entire syllabus, ensuring comprehensive preparation.
The guide includes previous years' question papers for students to familiarize themselves with the exam's format and difficulty level.
Additionally, it offers subject-specific question banks, allowing students to focus on weak areas and improve their performance.
Study Important Definitions & Formulas: Statistics on the App
Students of Class 10 can study Important Definitions & Formulas: Statistics alongwith tests & analysis from the EduRev app,
which will help them while preparing for their exam. Apart from the Important Definitions & Formulas: Statistics,
students can also utilize the EduRev App for other study materials such as previous year question papers, syllabus, important questions, etc.
The EduRev App will make your learning easier as you can access it from anywhere you want.
The content of Important Definitions & Formulas: Statistics is prepared as per the latest Class 10 syllabus.
|
© EduRev
|
Education Revolution
|


|


Signup to see your scores
go up
within 7 days!
within 7 days!
Takes less than 10 seconds to signup