Class 10 Maths Previous Year Questions - Statistics

Previous Year Questions 2025
Q1: The mean of seven observations is 17. If the mean of the first four observations is 15 and that of the last four observations is 18, then the fourth observation is:
(a) 14
(b) 13
(c) 12
(d) 10
 View Answer
Ans: (b)
Let x1, x2, x3 , x4, x5, x6 and x7 be first seven observations. 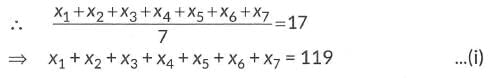
Adding (ii) and (iii) and then subtract (i), we get
(x1 + x2 + x3 + x4) + (x4 + x5 + x6 + x7) - (x1 + x2 + x3 + x4 + x5 + x6 + x7) = 60 + 72 - 119
⇒ x4 = 13
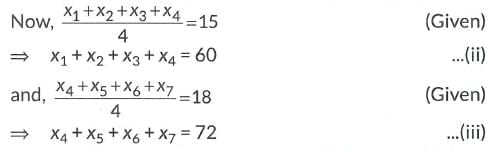
Q2: If the mean of 2, 9, x + 6, 2x + 3, 5, 10, 5 is 7, then the value of x is:
(a) 9
(c) 5
(b) 6
(d) 3
View Answer Ans: (d)
Given mean= 7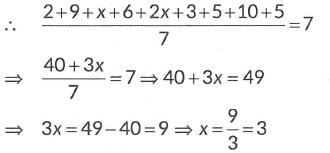
Q3: If the maximum number of students has obtained 52 marks out of 80, then
(a) 52 is the mean of the data.
(b) 52 is the median of the data.
(c) 52 is the mode of the data.
(d) 52 is the range of the data.
View Answer Ans: (c)
Q4: Mode and Mean of a data are 15x and 18x, respectively. Then the median of the data is :
(a) x
(c) 11x
(b) 17x
(d) 34x
View Answer Ans: (c)
Using empirical formula,
Mode = 3 Median - 2 Mean
⇒ 15x = 3 Median - 2(18x)
⇒ 3 Median = 15x + 36x
⇒ 3 Median = 51x
⇒ Median= 17x
Q5: If the mode of some observation is 10 and sum of mean and median is 25, then the mean and median respectively are
(a) 12 and 13
(c) 13 and 12
(b) 10 and 15
(d) 15 and 10
View Answer Ans: (b)
Given, Mode = 10
Mean+ Median= 25
By Empirical formula,
Mode = 3 Median - 2 Mean
⇒ 10 = 3(25 - Mean) - 2 Mean
⇒ 5 Mean= 65 ⇒ Mean= 13
∴ Median= 25 - 13 = 12
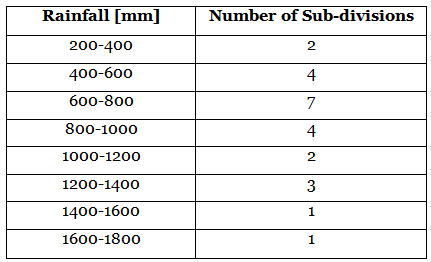
Q6: Case Study: The India Meteorological Department observes seasonal and annual rainfall every year in different sub-divisions of our country. It helps them to compare and analyse the results.  The table below shows sub-divisions wise seasonal (monsoon) rainfall (in mm) in 2023.
 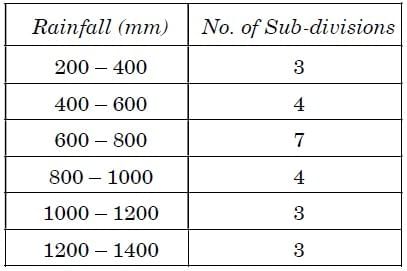 Based on the information given above, answer the following questions :
(i) Write the modal class. (1 Mark)
(ii) (a) Find the median of the given data. (2 Marks)
OR
(b) Find the mean rainfall in the season. (2 Marks)
(iii) If a sub-division having at least 800 mm rainfall during monsoon season is considered a good rainfall sub-division, then how many sub-divisions had good rainfall ? (1 Mark)
View Answer Ans: 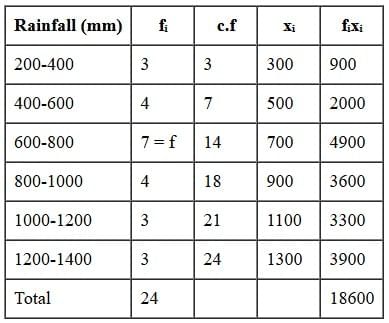
(i) Class corresponding to maximum frequency 7 is 600-800
∴ Modal class is 600-800.
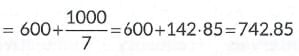
(ii) (a) Here, N/2 = 24/2 = 12
The cumulative frequency just greater than 12 is 14 and corresponding class is 600 - 800.
∴ Median class is 600-800.
Here, I= 600, N/2 = 12, f = 7, c.f = 7, h = 200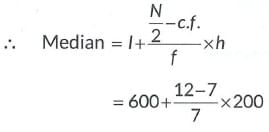
OR
(ii) (b) 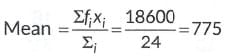
(iii) As a sub-division having at least 800 mm rainfall is considered as a good rain fall. Number of sub divisions that had good rain fall =4+3+3=10
Q7: The lengths of 40 leaves of plant are measured correct to the nearest millimeter, and the data obtained is r epresented in the following table: 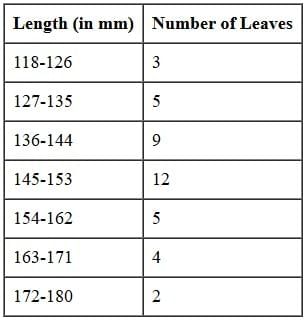 Find the median length of the leaves.
View Answer Ans: Here, the class intervals are not in inclusive form. So, we first convert them in inclusive form by subtracting 0.5 from lower limit and adding 0.5 to the upper limit. The given frequency distribution in inclusive form is as follows: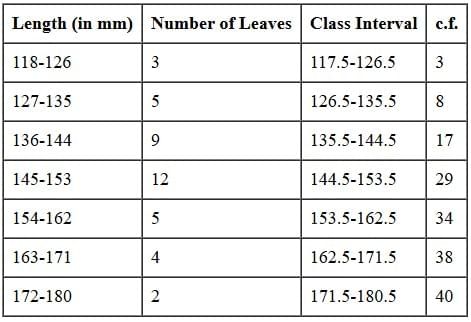 Here, N/2 = 40/2 = 20
⇒ Median class is 144.5-153.5
Here, I= 144.5, h = 9, c.f. = 17, f = 12 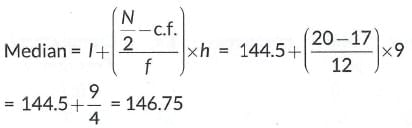
Hence, the median length of the leaves is 146.75 mm.
Q8: Following distribution shows the marks of 230 students in a particular subject. If the median marks are 46, then find the values of x and y. 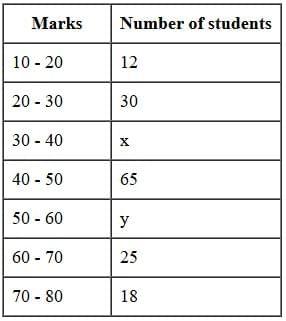
View Answer Ans:
Median= 46, N = 230, h = 10
∴ Median class= 40 - 50 ⇒ I = 40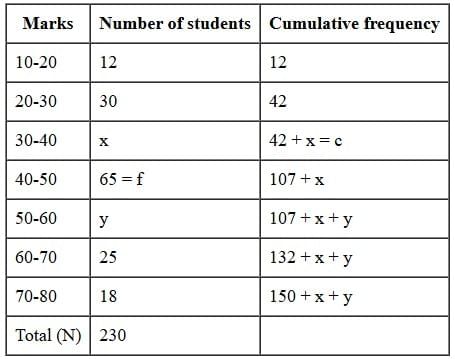
∴ 150 + x + y = 230 ⇒ x + y = 80 ..(i)
∴ f = 65 and c = 42 + x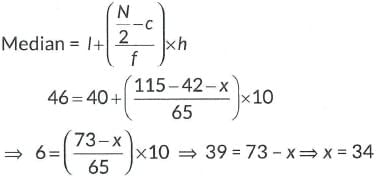
Using equation (i),
∴ we get y = 80 - 34 = 46
∴ x = 34 and y = 46
Previous Year Questions 2024
Q1: Vocational training complements traditional education by providing practical skills and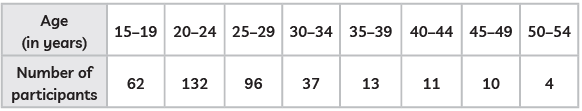 From the above answer the following questions: (4 & 5 Marks) (CBSE 2024)
(A) What is the lower limit of the modal class of the above data?
(B) Find the median class of the above data.
OR
Find the number of participants of age less than 50 years who undergo vocational training.
(C) Give the empirical relationship between mean, median and mode.
View Answer Ans:
First convert the given table in exclusive form subtract 0.5 from lower limit and add 0.5 to upper limit, so the new table will be: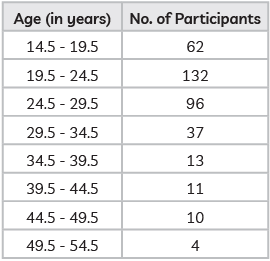
(i) Modal class is the class with highest frequency, so, it is 19.5 – 24.5. hence, lower limit will be ‘19.5’.
(ii) (a)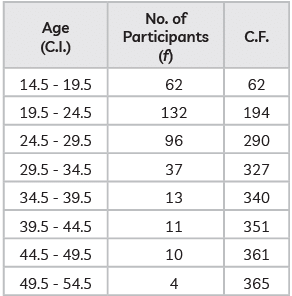
N/2 = 365/2 = 182.5
Medium class will be 19.5 – 24.5.
OR
(b) Approx 361 participants are there at Class Interval 44.5-49.5 showing 361 cummulative frequency.
Hence 361 participants are less than 50 year of age who undergo vocational training.
(iii) Empirical relationship between mean, median and mode.
Mode = 3 Median – 2 Mean
Previous Year Questions 2023
Q2: If the value of each observation of statistical data is increased by 3. then the mean of the data (1 Mark) (2023)
(a) remains unchanged
(b) increases by 3
(c) increases by 6
(d) increases by 3n
View Answer Ans: (b)
New Mean = Old Mean + 3
If each value of observation is increased by 3. then mean is also increased by 3.
Q3: For the following distribution. (1 Mark) (2023)
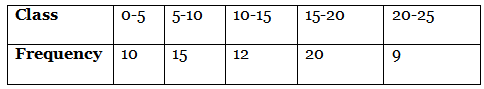
The sum of the lower limits of the median and modal class is
(a) 15
(b) 25
(c) 30
(d) 35
View Answer Ans: (b)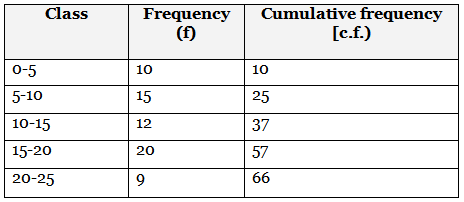
Here, n/2 = 66/2 = 33
Cumulative frequency just greater than 33 is 37.
So. median class is 10 - 15. Lower limit of median class = 10
Highest frequency is 20 so modal class is 15 - 20.
Sum of the lower limits of the median and modaI class is 10 + 15 = 25
Q4: India's meteorological department observes seasonal and annual rainfall every year in different subdivisions of our country.
It helps them to compare and analyse the results. The table given below shows sub-division-wise seasonal (monsoon] rainfall [mm) in 2018:
Based on the above information, answer the following questions.
(I) Write the modal class.
(II) Find the median of the given data.
Find the mean rainfall in this season.
(Ill) If a sub-division having at least 1000 mm rainfall during monsoon season, is considered a good rainfall sub-division, then how many sub-divisions had good rainfall? (4/5/6 Marks) (2023)
View Answer Ans: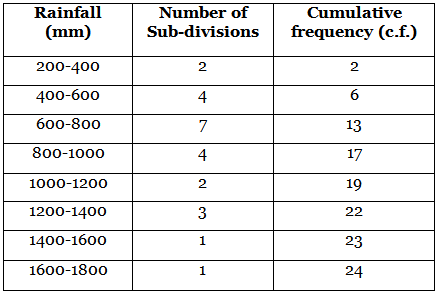
(i) Here, maximum class frequency is 7 and class corresponding to this frequency is 600-800, so the modal class is 600-800.
(ii) Here n/2 = 24/2 = 12
Class whose cumulative frequency just greater than and nearest to n/2 is called median class.
Here, cf. = 13 (>12) and corresponding class 600 - 800 is : median class.
1 = 600. c.f. = 6,f= 7, h = 200
∴ Median = l + n2 - c.f.f × h
= 600 + 12 - 67 × 200
= 600 + 67 × 200
= 771.429
So. the median of the given data is 771.429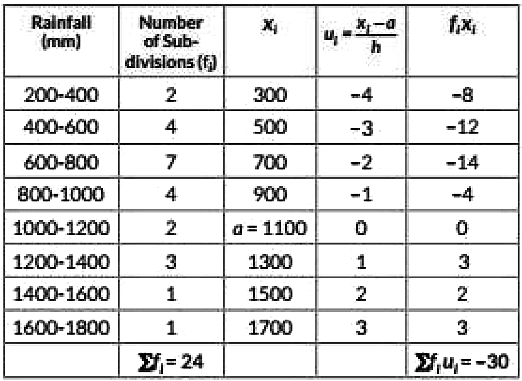
Assumed mean a = 1100 and class size, h = 400 - 200 = 200
∴ Mean = a + h∑ fi [∑ fi ui]
= 1100 + 20024 × (-30)
= 1100 - 600024
= 850
So, mean rainfall in the season is 850 mm.(iii) Number of sub-division having good rainfall
= 2 + 3 +1 + 1 = 7
Q5: The monthly expenditure on milk in 200 families of a Housing Society is given below
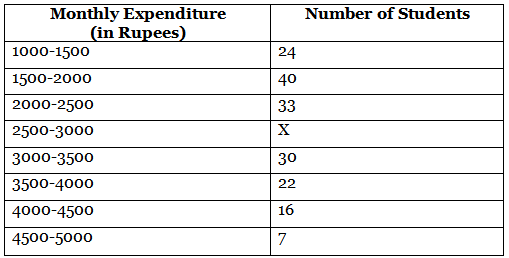
Find the value of x and also, find the median and mean expenditure on milk. (4/5/6 Marks) (CBSE 2023)
View Answer Ans:
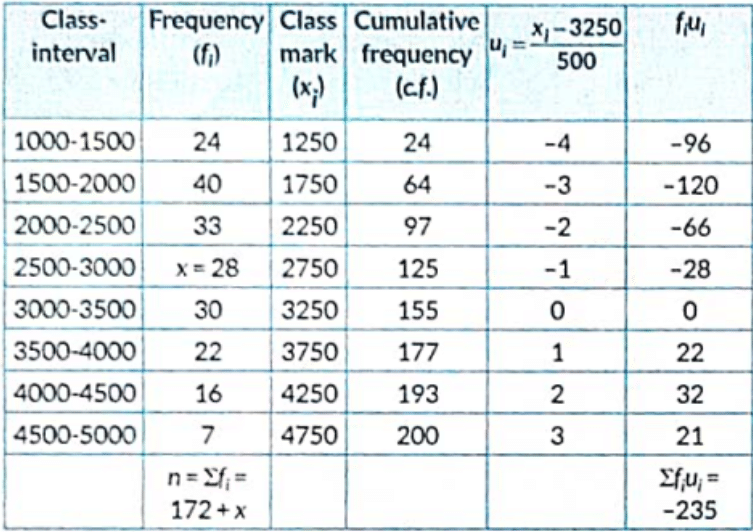
Since, 200 = 172 + x ⇒ x = 28
Let the assumed mean, a = 3250 and class size, h = 500
Mean( x̄ ) = a + h × 1n ∑ fi ui
= 3250 + 500 × 1200 × (-235)
= 3250 - 587.5 = 2,662.5
Mean expenditure = ₹ 2,662.5
Also, we have n/2 = 100, which lies in the class interval 2500 - 3000.
Median class is 2500 - 3000.
Here l = 2500, c.f. = 97, f = 28, h = 500
Median = l + n2 - c.f.f × h
= 2500 + 100 - 9728 × 500
= 2500 + 328 × 500
= 2553.57
∴ Median expenditure = ₹ 2553.57
Q6: For the following distribution:
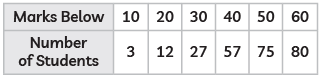
The modal class is:
(a) 10–20
(b) 20–30
(c) 30–40
(d) 50–60 (1 Mark) (CBSE 2023)
View Answer Ans: (c)
Step 1: Identify the Class Intervals
The table provided shows cumulative frequencies for marks below certain values:
- Marks below 10: 3 students
- Marks below 20: 12 students
- Marks below 30: 27 students
- Marks below 40: 57 students
- Marks below 50: 75 students
- Marks below 60: 80 students
To find the frequencies for each class, we calculate the difference between consecutive cumulative frequencies:
- 10−20: 12−3=9
- 20−30: 27−12=15
- 30−40: 57−27=30
- 40−50: 75−57=18
- 50−60: 80−75=5
So, the frequencies for each interval are:
- 10−20: 9
- 20−30: 15
- 30−40: 30
- 40−50: 18
- 50−60: 5
Step 2: Determine the Modal Class
The modal class is the class interval with the highest frequency. From the calculated frequencies, the highest frequency is 30, which corresponds to the class interval 30−40.
The modal class is: (c) 30−40.
Previous Year Questions 2022
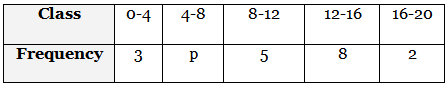
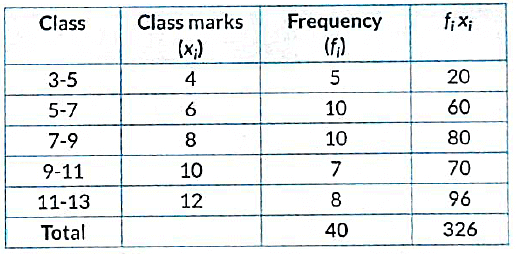
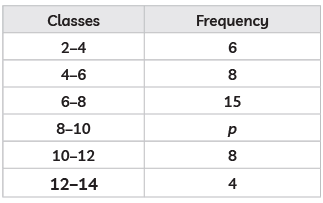
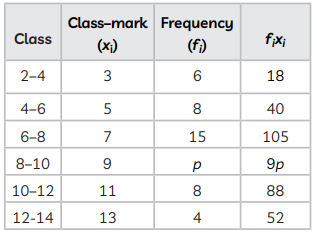
Q7: If the mean of the following frequency distribution is 10.8. then find the value of p: (2022)
 View Answer
 Ans: Table for the given data is as follows: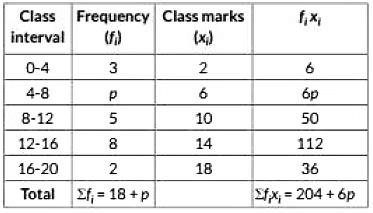
Now Mean =
10.8 = (2 × 3) + (6 × p) + (10 × 5) + (14 × 8) + (18 × 2)3 + p + 5 + 8 + 2
Solving for p:
10.8 = 6 + 6p + 50 + 112 + 3618 + p
10.8 = 204 + 6p18 + p
(10.8)(18 + p) = 204 + 6p
194.4 + 10.8p = 204 + 6p
4.8p = 9.6
p = 9.64.8
p = 2
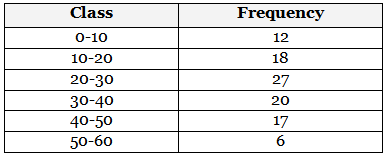
Q8: Find the mean of the following frequency distribution: (2022)
View Answer Ans:
Midpoint = Lower Limit + Upper Limit2
For the given class intervals:
- Midpoint of 0-10: 0 + 102 = 5
- Midpoint of 10-20: 10 + 202 = 15
- Midpoint of 20-30: 20 + 302 = 25
- Midpoint of 30-40: 30 + 402 = 35
- Midpoint of 40-50: 40 + 502 = 45
- Midpoint of 50-60: 50 + 602 = 55
Now, we'll multiply each midpoint by its corresponding frequency, sum up these products, and divide by the total frequency to find the mean:
Mean = ∑ (Midpoint × Frequency)Total Frequency
So, the mean is:
Mean = (5 × 12) + (15 × 18) + (25 × 27) + (35 × 20) + (45 × 17) + (55 × 6)
= 60 + 270 + 675 + 700 + 765 + 330
Mean = 2800100
Mean = 28
Q9: The weights (in kg) of 50 wild animals of a National Park were recorded and the following data was obtained is
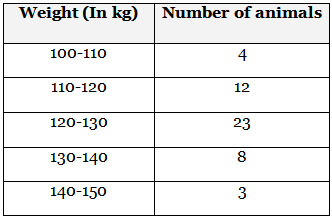
Find the mean weight (in kg) of animals, using the assumed mean method. (2022)
View Answer Ans: Let the assumed mean, a = 125 We have the frequency distribution table for the given data as follows :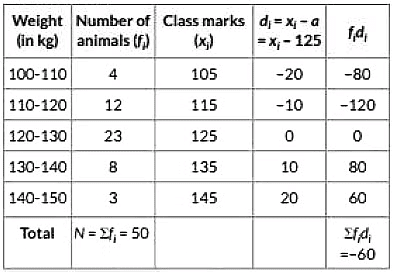
∴ Mean ( x̄ ) = a + 1N ∑ fi di
= 125 + 150 × (-60)
= 125 - 6050
= 125 - 1.2 = 123.8
Hence, mean weight of animals = 123.8 kg.
Q10: The mean of the following frequency distribution is 25. Find the value off. (2022)
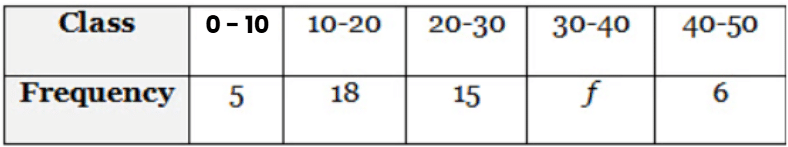
View Answer Ans: The frequency distribution table from the given data is as follows: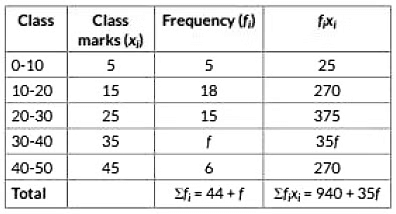
∴ Mean ( x̄ ) = ∑ fi xi∑ fi
⇒ 25 = 940 + 35f44 + f [∵ Given, mean = 25]
⇒ 25(44 + f) = 940 + 35f
⇒ 1100 + 25f = 940 + 35f
⇒ 10f = 160
⇒ f = 16
Hence, the value of f is 16.
Q11: Find the mean of the following data using the assumed mean method. [2022, 2 Marks]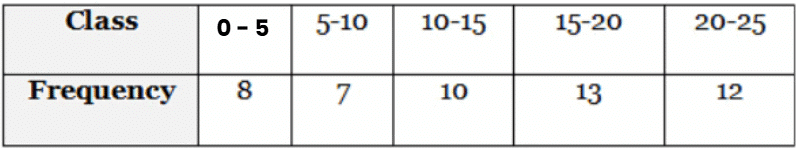
View Answer Ans: Let the assumed mean, a = 12.5 .-. d
⇒ d = xi - a = xi - 12.5
Now, we have the frequency distribution table as follows: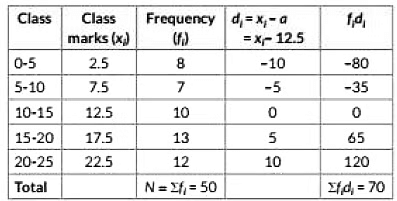
∴ Mean ( x̄ ) = a + 1N ∑ fi di
= 12.5 + 7050
= 12.5 + 1.4
= 13.9
Q12: The mode of a grouped frequency distribution is 75 and the modal class is 65-80. The frequency of the class preceding the modal class is 6 and the frequency of the class succeeding the modal class is 8. Find the frequency of the modal class. (2022)
View Answer Ans: We know that
Mode = l + f1 - f02f1 - f0 - f2 × h ... (i)
Here given l = 65, f0 = 6, f1 = f, h = 15, f2 = 8 and mode = 75
So, from equation (i), we get
75 = 65 + f - 62f - 6 - 8 × 15
75 = 65 + f - 62f - 14 × 15
75 - 65 = (f - 6) × 152f - 14
(2f - 14) × 10 = 15f - 90
⇒ 20f - 15f = -90 + 140
⇒ 5f = 50
∴ f = 10
Q13: Find the missing frequency 'x ' of the following data, if its mode is 240: (2022)
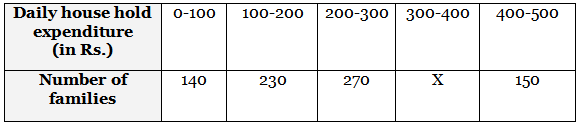
View Answer Ans: Here the given mode = 240, which lies in interval 200-300.
l = 200, f0 = 230, f1= 270, f2 = x (missing frequency] and h = 100
∴ Mode = l + f1 - f02f1 - f0 - f2 × h
240 = 200 + 270 - 2302 × 270 - 230 - x × 100
240 = 200 + 40310 - x × 100
⇒ 240 - 200 = 4000310 - x
⇒ 40 = 4000310 - x
⇒ 310 - x = 100
⇒ x = 310 - 100 = 210
Missing frequency, x = 210
Q14: If the mode of the following frequency distribution is 55, then find the value of x. (2022)
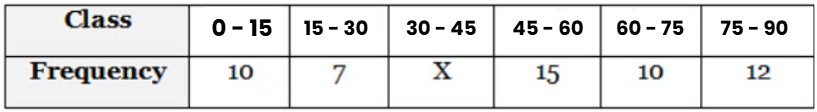
View Answer Ans: Here, mode of the frequency distribution = 55.
which lies in the class interval 45-60.
∴ Modal class is 45 - 60
Lower limit (l) = 45
Class interval (h) = 15
Also, f 0 = 15, f 1 = x and f 2 = 10
Mode = l + f0 - f12f0 - f1 - f2 × h
⇒ 55 = 45 + 15 - x30 - x - 10 × 15
⇒ 55 - 45 = 15(15 - x)30 - x - 10
⇒ 10(30 - x - 10) = 225 - 15x
⇒ 300 - 10x - 100 = 225 - 15x
⇒ 5x = 25
⇒ x = 5
Q15: Heights of 50 students in class X of a school are recorded and the following data is obtained: (2022)
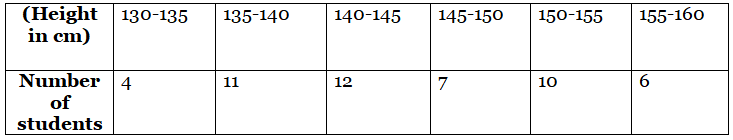
Find the median height of the students.
View Answer Ans: The cumulative frequency distribution table is as follows:
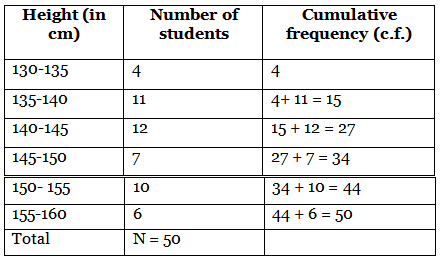
Now, we have N = 50
⇒ N2 = 502 = 25
Since, the cumulative frequency just greater than 25 is 27.
∴ The median class is 140 - 145
And also, l = 140, c.f. = 15, f = 12 and h = 5
∴ Median = l + N2 - c.f.f × h
= 140 + 25 - 1512 × 5
= 140 + 1012 × 5
= 140 + 4.16 = 144.16
∴ Median height of the students = 144.16 cm.
Q16: Health insurance is an agreement whereby the insurance company agrees to undertake a guarantee of compensation for medical expenses in case the insured faffs ill or meets with an accident that leads to the Hospitalisation of the insured. The government also promotes health insurance by providing a deduction from income tax.
An SB I health insurance agent found the following data for the distribution of ages of 100 policyholders.
The health insurance policies are given to persons aged 15 years and onwards briefest than 60 years.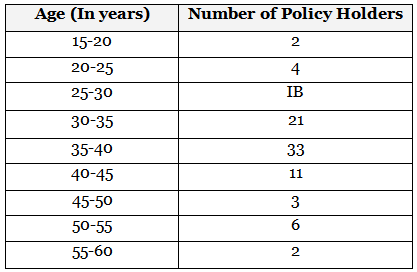
(i) Find the modal age of the policy holders.
(ii) Find the median age of the policy holders. (2022)
View Answer Ans: (i) It is clear from the given data, maximum frequency is 33. which lies in 35 - 40
∴ Modal class is 35 - 40.
So, l = 35, f0 = 21, f1 = 33, f2 = 11, and h = 5
∴ Mode = l + f1 - f02f1 - f0 - f2 × h
So, modal age of policy holders
= 35 + 33 - 212 × 33 - 21 - 11 × 5
= 35 + 1234 × 5
= 35 + 6034
= 35 + 1.76
= 36.76 (approx)
So, modal age of policy holders is 37 years approx.
Previous Year Questions 2021
Q17: During the annual sports meet in a school, all the athletes were very enthusiastic. They all wanted to be the winner so that their house could stand first. The instructor noted down the time taken by a group of students to complete a certain race. The data recorded is given below: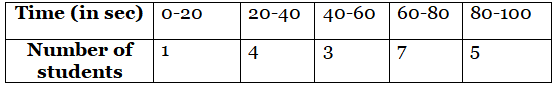
Based on the above, answer the following questions: (2021)
We need to make the following frequency table as follows:
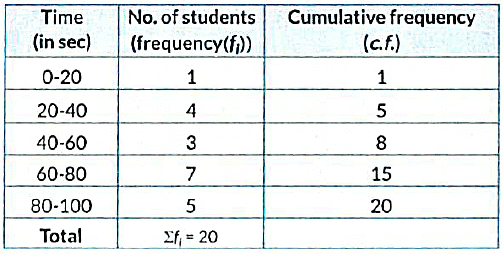
(i) What is the class mark of the modal class?
(a) 60
(b) 70
(c) 80
(d) 140
View Answer Ans: (b)
Here the greatest frequency is 7, which lies in the interval 60-80.
So, modal class is 60-80.
Class mark of modal class = upper limit + lower limit / 2
= 60 + 80 / 2 = 70
So, class mark of modal class is 70.
(ii) The mode of the given data is
(a) 70-33
(b) 71-33
(c) 72-33
(d) 73-33
View Answer Ans: (d)
h = 20, l = 60, f1 = 7, f0 = 3, f2 = 5
∴ Mode = l + f1 - f02f1 - f0 - f2 × h
= 60 + 7 - 32 × 7 - 3 - 5 × 20
= 60 + 46 × 20
= 60 + 13.33
Mode = 73.33
(iii) The median class of the given data is
(a) 20-40
(b) 40-60
(c) 80-100
(d) 60-80
View Answer Ans: (d)
Here n = 20 ⇒ n /2 = 10
Cumulative frequency just greater than 10 is 15 and corresponding interval is 60-80.
So, median class is 60-80.
(iv) The sum of the lower limits of median class and modal class is 1
(a) 80
(b) 140
(c) 120
(d) 100
View Answer Ans: (c)
Median class = 60-80 .
∴ Lower limit of median = 60
Modal class - 60-80 = 120
∴ Lower limit of modal class = 60
So, the sum of lower limit of median and modal class = 60 + 60 = 120
(v) The median time (in seconds) of the given data is
(a) 65-7
(b) 85-7
(c) 45-7
(d) 25-7
View Answer Ans: (a)
From the above data, we have
l = 60, f = 7, c.f. = 8, h = 20
∴ Median = l + n2 - c.f.f × h
= 60 + 202 - 87 × 20
= 60 + 10 - 87 × 20
= 60 + 407
= 60 + 5.714
= 65.71 (approx)
So, median time (in sec) of the given data = 65.7 sec.
Previous Year Questions 2020
Q18: If the mean of the first n natural number, is 15, then find n. (2020)
View Answer Ans: Given, mean of first n natural numbers is 15.
⇒ 1 + 2 + 3 + ..... + nn = 15
⇒ 1 + 2 + 3 + ..... + n = 15n
⇒ n(n + 1)2 = 15n
⇒ n² + n = 30n
⇒ n² - 29n = 0
⇒ n(n - 29) = 0
⇒ n = 29 [n ≠ 0]
Q19: In the formula 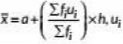 , What is ui? (2020)
View Answer Ans: In the formula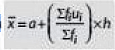

where a is assumed mean and h = class size.
Q20: Find the mean of the following distribution: (2020)
View Answer Ans: The frequency distribution table from the given data can be drawn as :
∴ Mean = 326/40 = 8.15
Q21: Find the mode of the following distribution: (2020)
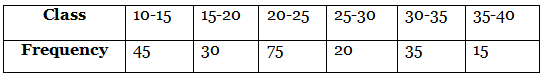
View Answer Ans: From the given data, we have maximum frequency 75. which lies in the interval 20-25.
Modal class is 20-25
So, l = 20, f0= 30, f1 = 75, f2= 20, h = 5
∴ Mode = l + f1 - f02f1 - f0 - f2 × h
= 20 + 75 - 302(75) - 30 - 20 × 5
= 20 + 45100 × 5
Mode = 20 + 2.25
= 22.25
Q22: Find the mode of the following distribution: (2020)
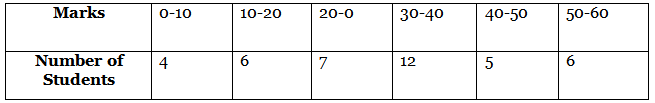
View Answer Ans: From the given data, we have maximum frequency 12.
which lies in the interval 30-40
Modal class is 30-40
So, l = 30, f0= 12, f1 = 7, f2= 5, h = 10
Mode = l + f1 - f02f1 - f0 - f2 × h
= 30 + 12 - 72 × 12 - 7 - 5 × 10
= 30 + 524 - 12 × 10
= 30 + 5012
= 30 + 4.17
= 34.17
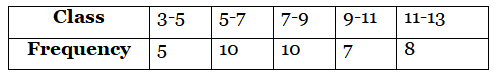
Q23: Find the mode of the following distribution: (2020)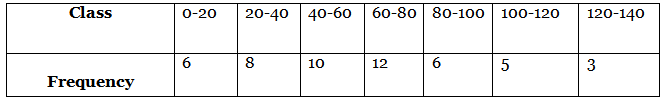
View Answer Ans: From the given data, we have maximum frequency 12.
which lies in the interval 60-80.
Modal class is 60-80
So, l = 60, f0= 12, f1 = 10, f2= 6, h = 20
Mode = l + f1 - f02f1 - f0 - f2 × h
= 60 + 12 - 102 × 12 - 10 - 6 × 20
= 60 + 224 - 16 × 20
= 60 + 28 × 20
= 60 + 5
= 65
Q24: The mean and median of distribution are 14 and 15 respectively. The value of mode is (2020)
(a) 16
(b) 17
(c) 13
(d) 18
View Answer Ans: (b)
We know that Mode = 3 Median - 2 Mean
So, Mode = 3 x 15 - 2 x 14
= 45 - 28 = 17
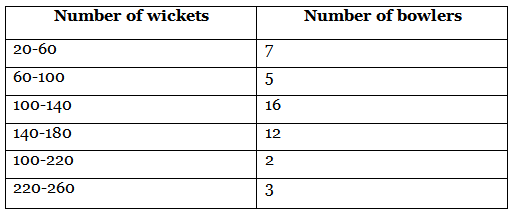
Q25: The distribution given below shows the number of wickets taken by bowlers in one-day cricket matches. Find the mean and the median of the number of wickets taken. (2020)
View Answer Ans: The frequency distribution table for the given data can be drawn as:
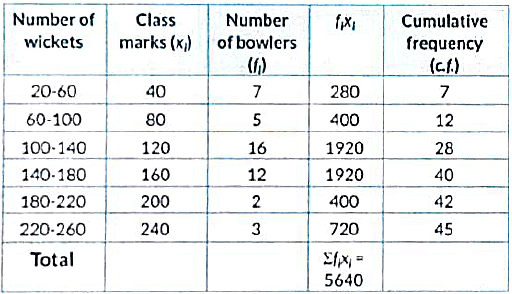
Mean = ∑ fi xi∑ fi = 564045 = 125.33
Here, N2 = 452 = 22.5
∴ Median class is 100-140.
Also, l = 100, c.f. = 12, f = 16, h = 40
So, Median = l + N2 - c.f.f × h
= 100 + 22.5 - 1216 × 40
= 100 + 10.516 × 40
= 100 + 26.25= 126.25
Hence, mean number of wickets is 125.33 and median number of wickets is 126.25.
Q26: Find the value of p, if the mean of the following distribution is 7.5. (CBSE 2020)
View Answer Ans:
 Here, Σfi = 41 + p
and Σfixi = 303 + 9p
We know, Mean = ∑ fi xi∑ fi
But, Mean = 7.5 [Given]
∴ 7.5 = 303 + 9p41 + p
⇒ 303 + 9p = 307.5 + 7.5p
⇒ 1.5p = 4.5
⇒ p = 3
Hence, the value of p is 3.
Previous Year Questions 2019
Q27: The arithmetic mean of the following frequency distribution is 53. Find the value of k. (2019)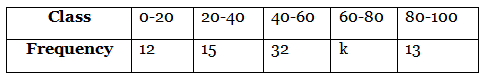
View Answer Ans: The frequency distribution table from the given data is as follows:
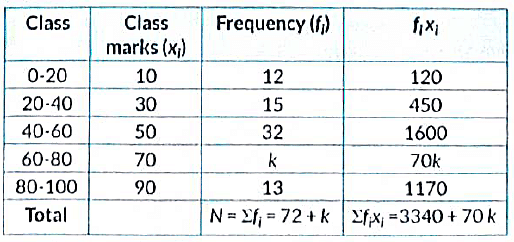
Now, mean = ∑ fi xi∑ fi = 53 [Given]
∴ 3340 + 70k72 + k = 53
⇒ 3340 + 70k = 3816 + 53k
⇒ 70k - 53k = 3816 - 3340
⇒ 17k = 476
⇒ k = 28
Q28: Find the mean of the following frequency distribution:
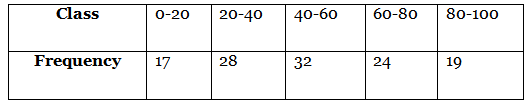
View Answer Ans: he frequency distribution table from the given data is as follows:
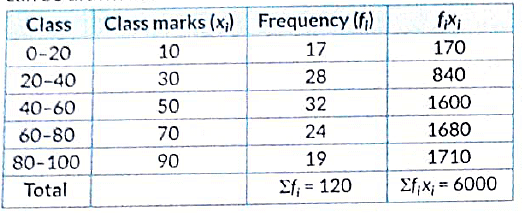
∴ 
= 50
Q29: If the mean of the following frequency distribution is 62.8, then find the missing frequency x: (2019)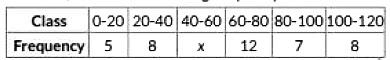
View Answer Ans: Here h = 20
Let us construct the following table far the given data.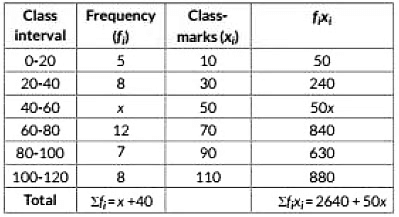
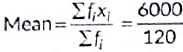
We know that Mean = ∑ fi xi∑ fi
⇒ 62.8 = 2640 + 50x40 + x
⇒ 62.8(40 + x) = 2640 + 50x
⇒ 2512 + 62.8x = 2640 + 50x
⇒ 62.8x - 50x = 2640 - 2512
⇒ 12.8x = 128 ⇒ x = 12812.8
Q30: The weights of tea in 70 packets are given in the following table: (2019)
Find the modal weight.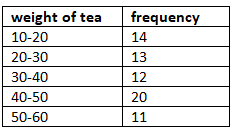
View Answer Ans: From the given data, we observe that, highest frequency is 20,
which lies in the class-interval 40-50.
∴ l = 40, f1 = 20, fo= 12, f2 = 11, h = 10
Mode = l + f1 - f02f1 - f0 - f2 × h
= 40 + 20 - 1240 - 12 - 11 × 10
= 40 + 8017
= 40 + 4.7 = 44.7
Q31: If the median of the following frequency distribution is 32.5, find the values of f1 and f2. (2019)
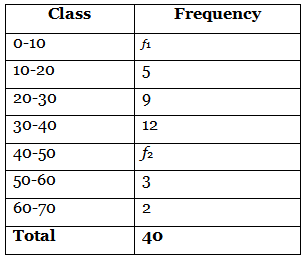
View Answer Ans: The frequency distribution table for the given data is as follows:
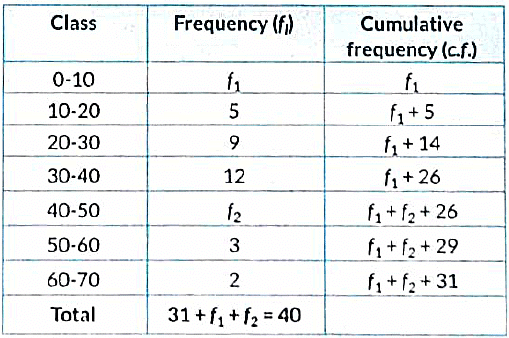
Here, N = 40 ⇒ 31 + f1 + f2 = 40
⇒ f1 + f2 = 9 ...(i)
Given, median = 32.5, which lies in the class interval 30-40.
So, median class is 30-40.
I = 30, h = 10, f = 12, N = 40 and c.f. of preceding class = f1 + 14
Now, median = l + N2 - c.f.f × h
⇒ 32.5 = 30 + 20 - (f1 + 14)12 × 10
⇒ 2.5 = 6 - f112 × 10
⇒ 6 - f1 = 3 ⇒ f1 = 3
From (i), f2 = 9 - 3 = 6
Q32: Find the values of frequencies x and y in the following frequency distribution table, if N = 100 and median is 32. (2019)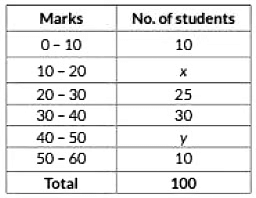
View Answer Ans: The frequency distribution table for the given data is as follows: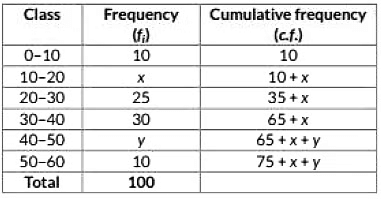
Here. N = 100, median = 32, it lies in the Interval 30 - 40.
∴ Median = l + N2 - c.f.f × h
⇒ 32 = 30 + 50 - (35 + x)30 × 10
⇒ 32 - 30 = 15 - x3
⇒ 15 - x = 6
⇒ x = 9
Also, 75 + x + y = 100
⇒ 75 + 9 + y = 100
⇒ y = 100 - 84 = 16
|
129 videos|736 docs|84 tests
|
FAQs on Class 10 Maths Previous Year Questions - Statistics
| 1. What are the benefits of studying previous year questions for exam preparation? |  |
| 2. How can I effectively use previous year questions for my studies? | |
| 3. Are previous year questions available for all subjects and exams? | |
| 4. How many previous year questions should I practice before the exam? | |
| 5. Where can I find reliable sources for previous year question papers? | |


study material
,Semester Notes
,Sample Paper
,Important questions
,Extra Questions
,shortcuts and tricks
,Class 10 Maths Previous Year Questions - Statistics
,Summary
,Previous Year Questions with Solutions
,past year papers
,Objective type Questions
,Viva Questions
,mock tests for examination
,video lectures
,MCQs
,Class 10 Maths Previous Year Questions - Statistics
,Class 10 Maths Previous Year Questions - Statistics
,practice quizzes
,Free
,Exam
,ppt
;


Previous Year Questions: Statistics Free PDF Download
Importance of Previous Year Questions: Statistics
Previous Year Questions: Statistics Notes
Previous Year Questions: Statistics Class 10
Study Previous Year Questions: Statistics on the App
|
© EduRev
|
Education Revolution
|


|


