Worksheet Solutions: Smart Charts - 1

Q: Answer the following Questions.
(i) Write the shaded part as a fraction.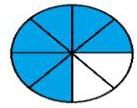 Ans: 6/8
(ii) From the chart, find the total number of children who like the food by them and answer the following.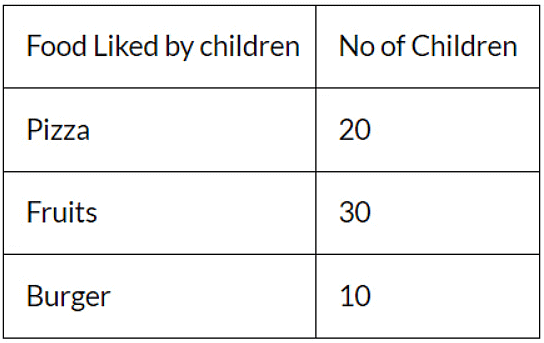
(a) _______children like fruit.
Ans: 30
(b) Children who like fruits are the total children.
Ans: 1/2
(c) Eating Fruit is good. (True/False)
Ans: True
(d) Eating burgers and Pizza is bad. (True/False)
Ans: True
(iii) Find out with the help of the pie chart which of the following activity people are spending most of the time.
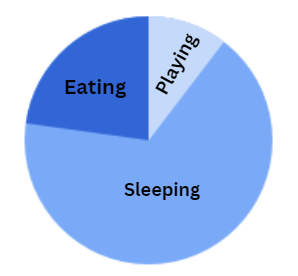
Ans: Sleeping
(iv) See the table below and answer: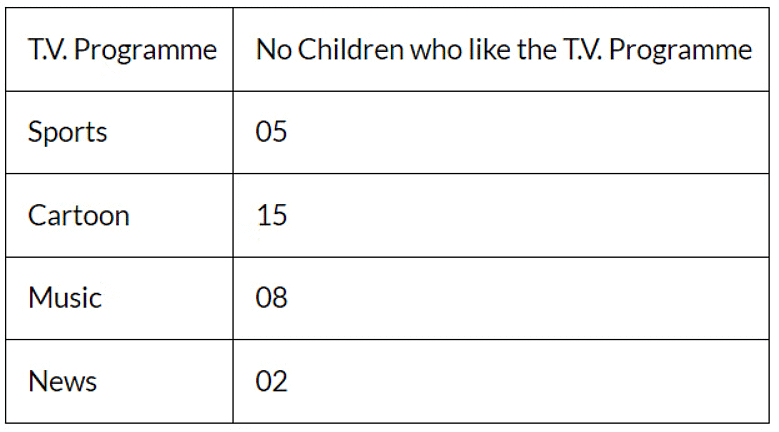
(a) How many children like music programs?
Ans: 08
(b) How many children like sports programs?
Ans: 05
(c) Which program is like by a maximum number of children?
Ans: Cartoon
(d) Watching T.V. for longer hours is bad? (True/False)
Ans: True
(v) Go through the given graph and answer the following questions.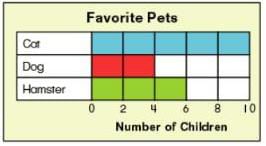 How many children like cats more than that hamsters?
Ans: 4
(vi) Look at the figure and answer: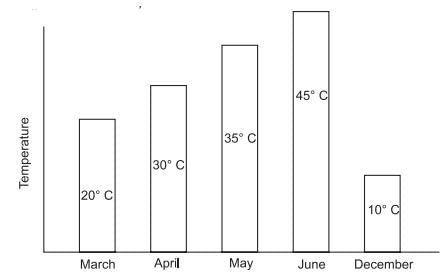 (a) Maximum temperature = _________.
Ans: 45°C
(b) Minimum temperature = _________.
Ans: 10°C
(c) Temperature in the month of March = _________.
Ans: 20°C
(d) 30° C is the temperature in the month of = ___________.
Ans: April
(vii) The chart shows the result of a school in different years.
Fill in the blanks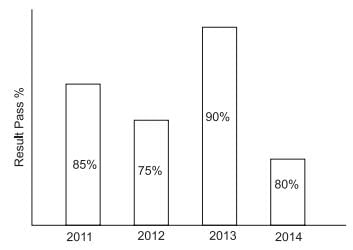
(a) 75% result was in ________ year
Ans: 2012
(b) In 2014 result was ________ %
Ans: 80%
(c) Maximum result was in ________ year.
Ans: 2013
(d) Difference of maximum and minimum result ________.
Ans: 15%
(viii) Mia says that the number of people who travel by Bus and Bike is equal to the number of people who travel by car. Is she correct?
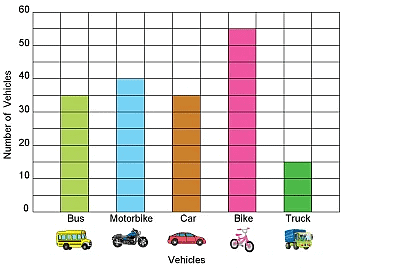 Ans: NO, she is wrong.
(ix) There are 400 students in a school. All the students take part in different clubs. See the pie chart and answer the following :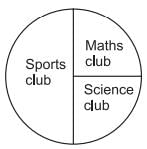 (a) Maths club has _____ students
Ans: 100
(b) Science club has _____ students
Ans: 100
(c) Sports club has _____ students
Ans: 200
(d) Maths club students + Science club students = ______ students
Ans: 200
(x) From the chart below, answer the questions :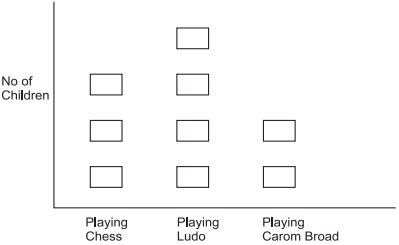 (a) How many children are playing chess?
Ans: 3
(b) How many children are playing Ludo?
Ans: 4
(c) How many children are playing Carom Board?
Ans: 2
(d) It is good to play indoor games during summer vacation. (True/False)
Ans: True
(xi) Use the graph to answer the following questions.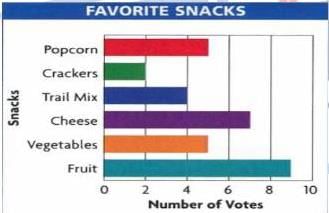 How many votes did cheese get as a favorite snack?
Ans: 7
(xii) See the chart below and answer :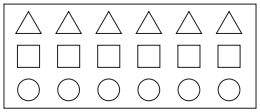 (a) How many triangles are there in the chart?
Ans: 6
(b) Number of circles are ______
Ans: 6
(c) Number of squares are ________
Ans: 6
(d) Total no. of geometrical figures is ____________
Ans: 18
(xiii) Go through the given graph and answer the following questions: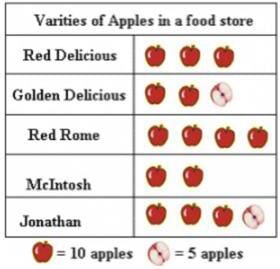 Which variety of apples has the maximum number of apples?
Ans: Red Rome (40 apples)
(xiv) Following chart shows the ages of some students.
Fill in the blanks.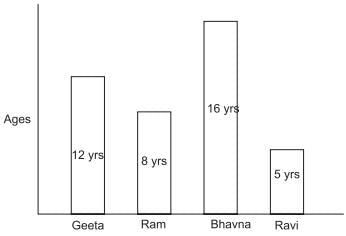 (a) Age of Ram is ________
Ans: 8 years
(b) ________ is the youngest
Ans: Ravi
(c) ________ is the eldest
Ans: Bhawna
(d) Sum of Geeta and Ravi's age = ________
Ans: 17 yrs
(xv) Go through the given graph and answer the following questions:How many apples are red delicious?
Ans: 30 apples
(xvi) Write the un-shaded part as a fraction. Ans: 1/3
(xvii) Go through the given graph and answer the following questions: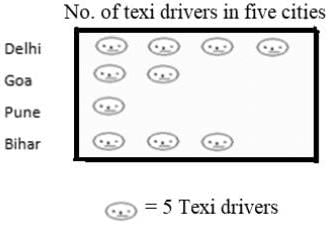 What is the difference between the number of taxi drivers in Goa and Bihar?
Ans: 5 taxi drivers
(xviii) Go through the given graph and answer the following questions.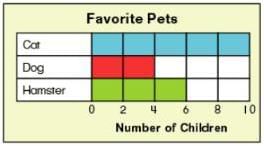 How many kids have hamsters as their favorite pets?
Ans: 6
FAQs on Worksheet Solutions: Smart Charts - 1
| 1. What is a smart chart? |  |
| 2. How can smart charts be used in educational settings? | |
| 3. What are the advantages of using smart charts in data analysis? | |
| 4. What are the different types of smart charts? | |
| 5. Can smart charts be customized? | |