Pressure Belts of the Earth


Pressure
Atmospheric pressure is the weight of the column of air above a unit area of the Earth's surface at a given place and time.
- Atmospheric pressure is measured as force per unit area; pressure = force ÷ area.
- An instrument used to measure atmospheric pressure is called a barometer. Common types are the mercury barometer and the aneroid barometer.
- In meteorology the usual unit is the millibar (mb), also equal to the hectopascal (hPa). One millibar is approximately the pressure exerted by a mass of about one gram per square centimetre.
- The standard mean sea-level pressure is about 1013.25 mb (hPa).
Factors Controlling Pressure Systems
Pressure differences that produce the Earth's major pressure belts arise from two broad sets of controls: thermal and dynamic factors. Both operate together to determine the horizontal and vertical distribution of pressure.
Thermal Factors
- When air is heated it expands, its density decreases and the surface pressure tends to fall; conversely, cooling contracts air, increases density and raises surface pressure.
- Large-scale thermal contrasts produce characteristic pressure features: for example, the warm equatorial region gives rise to the equatorial low (a thermal low), while the cold polar regions produce the polar highs (thermal highs).
Dynamic Factors
- Dynamic controls arise from forces acting on moving air: the pressure-gradient force, the Coriolis force (due to Earth's rotation) and centrifugal effects associated with curved flows.
- These dynamic forces modify where rising and descending air occur, and therefore influence the position and intensity of pressure belts.
Try yourself: Atmospheric pressure is measured by
Pressure Gradient
The pressure gradient is the rate of change of atmospheric pressure between two points on the Earth's surface. It is the driving force for winds.
- On weather charts the pressure gradient is shown by the spacing of isobars (lines of equal pressure). Close isobars indicate a strong pressure gradient and stronger winds; widely spaced isobars indicate a weak gradient and lighter winds.
Vertical Distribution of Pressure
- The vertical distribution of atmospheric pressure describes how pressure changes with height in the atmosphere. The air column above compresses the lower layers, so pressure decreases with altitude.
- The hydrostatic balance expresses this change: dp/dz = -ρg, where p is pressure, z is height, ρ is air density and g is gravitational acceleration. This relation explains why pressure falls rapidly near the surface and more slowly aloft.
- Because density and temperature vary with height, the rate of pressure decrease is not linear; a useful concept is the scale height, H = RT/g, which gives the height over which pressure decreases by about a factor of e. For Earth's atmosphere H is typically of the order of 7-9 km.
- A rising barometer (increasing pressure) usually indicates stable, fair weather; a falling barometer (decreasing pressure) indicates that more active or unsettled weather is approaching.
Horizontal Distribution of Pressure
The horizontal variation of pressure over the globe (pressure belts) is controlled mainly by the following factors:
- Air temperature - Regions receiving intense insolation (the tropics) heat the air, producing low pressure; cold regions (the poles) lead to higher pressure.
- Earth's rotation - The Coriolis force deflects moving air to the right in the Northern Hemisphere and to the left in the Southern Hemisphere, shaping wind directions and the position of pressure belts.
- Presence of water vapour - Moist air is less dense than dry air at the same temperature and pressure; increased water vapour tends to be associated with lower surface pressure locally.
Air Temperature
- The Earth is heated unevenly: insolation is greatest at and near the equator and decreases poleward.
- Equatorial regions have low surface pressure because warm air rises (convection) and reduces surface mass per unit area.
- Polar regions show higher surface pressure because cold, dense air tends to sink and accumulate near the surface.
The Earth's Rotation
- Rotation gives rise to the Coriolis effect, which causes deflection of wind from its initial straight-line path and influences the formation of global wind belts and pressure systems.
- The interaction of the pressure-gradient force and Coriolis force determines the overall wind pattern around pressure systems: geostrophic or gradient balance applies at synoptic scales away from frictional effects.
Presence of Water Vapour
- Air containing more water vapour generally has lower surface pressure than equally warm dry air because molecular weight of water vapour is less than that of dry air.
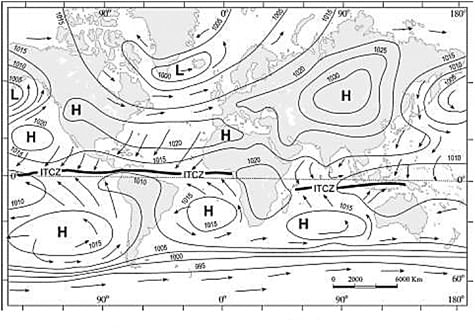
World Pressure Belts
On the Earth's surface, the large-scale horizontal pressure pattern can be idealised into seven principal belts in each annual mean position:
- Equatorial Low (a single belt along the thermal equator)
- Two Sub-tropical Highs (one in each hemisphere)
- Two Sub-polar Lows or Circum-polar Lows (one in each hemisphere)
- Two Polar Highs (one at each pole)
Equatorial Low Pressure Belt
- The equatorial low extends roughly from the Equator to about 5°N and 5°S, and more broadly along the thermal equator where solar heating is strongest.
- Intense heating produces strong convection; warm air rises leading to persistently low surface pressure and abundant cloud and rain-this is the primary region of tropical convective activity.
- This region of calm, converging surface winds and frequent thunderstorms is often called the doldrums.
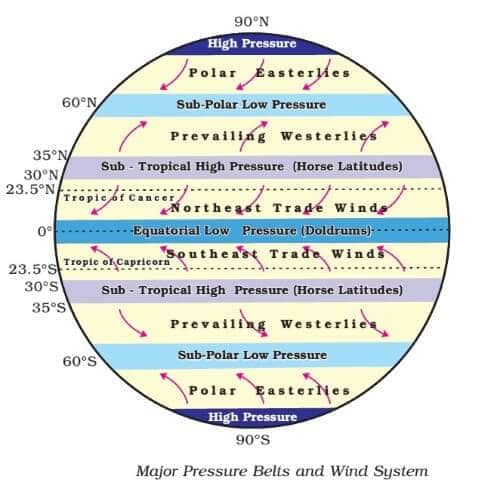
Sub-tropical High Pressure Belts
- Near about 30°N and 30°S, the air that rose near the equator descends; subsidence produces an area of high pressure called the sub-tropical highs or horse latitudes.
- Surface winds flow from these highs toward the equator as trade winds and toward the mid-latitudes as westerlies.
- The descending air is generally dry; many of the world's great deserts (e.g. Sahara, central Australian deserts) occur in these subtropical latitude bands.
Circum-polar (Sub-polar) Low Pressure Belts
- Between roughly 60° and 70° in each hemisphere is a zone of rising air where cold polar air meets warmer mid-latitude air; this is the sub-polar or circum-polar low.
- In these latitudes, ascending motion, frontal activity and cyclonic storms are common-especially in winter, when contrasts between polar and mid-latitude air are strongest.
Polar High Pressure Areas
- From about 70° to the pole in each hemisphere, permanently cold, dense air descends and produces the polar highs.
- These regions are characterised by cold, stable conditions and extensive ice caps.
Try yourself: Which layer of atmosphere is responsible for Aurora Borealis?
The Coriolis Effect
- The Coriolis force is an apparent force due to Earth's rotation that deflects moving objects (including air) to the right in the Northern Hemisphere and to the left in the Southern Hemisphere.
- The magnitude of the Coriolis effect depends on the angular speed of rotation and the latitude; it is proportional to 2Ω sin φ, where Ω is Earth's angular velocity and φ is latitude.
- Coriolis deflection is negligible near the Equator and increases toward the poles; this variation helps determine how many circulation cells appear in a planet's atmosphere (faster rotation and larger planetary radius favour more, narrower cells).
Atmospheric Circulation
Atmospheric circulation is the large-scale movement of air by which heat and momentum are redistributed on the Earth's surface and within the atmosphere. Two useful ways to describe circulation are by latitude (meridional) and by longitude (zonal) patterns.
Latitudinal Circulation - The Three-Cell Model
The idealised three-cell meridional circulation in each hemisphere consists of the Hadley cell, the Ferrel cell and the Polar cell. These cells explain the major wind belts and mean rising/descending regions.
The Hadley Cell
- Strong solar heating near the Equator produces intense convection; warm air rises and diverges aloft toward higher latitudes.
- At the tropopause the poleward flow is deflected by the Coriolis force until, near about 30° latitude, the flow descends, warms and dries. This subsidence forms the sub-tropical high.
- The surface return flow toward the Equator, deflected by Coriolis, becomes the trade winds.
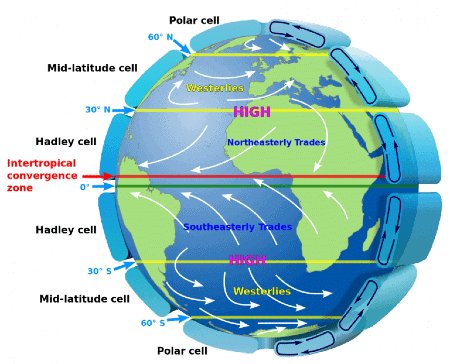
Mid-latitudes - The Ferrel Cell
- The Ferrel cell lies between the Hadley and Polar cells (roughly 30°-60°). It is a dynamical, indirect cell in which surface westerlies transport heat poleward.
- Weather systems (mid-latitude cyclones and anticyclones) and the jet streams dominate the Ferrel cell; the polar and subtropical jet streams mark cell boundaries near the tropopause.
- Deserts at ~30° are associated with descending air of the Ferrel/Hadley interaction.
The Polar Cell
- In the polar cell, air rises near ~60° latitude and moves poleward aloft. Over the pole it cools, descends and flows equatorward near the surface as the polar easterlies.
- The Polar cell produces the cold, high pressure that characterises the polar regions and tends to make the poles climatologically dry (polar deserts).
Try yourself: Horse latitudes lie within the atmospheric pressure belts of
Longitudinal Circulation - Walker Circulation
- The Walker circulation is an east-west (zonal) overturning circulation in the tropical Pacific, driven by longitudinal differences in sea-surface temperature and pressure.
- Normally, stronger trade winds push warm surface water westward, producing warm waters in the western Pacific and upwelling of cold, nutrient-rich waters off the coast of South America-this supports rich fisheries.
- When trade winds weaken or reverse, warm water spreads eastward across the Pacific and coastal upwelling weakens; this warm event is called El Niño. The coupled change in tropical Pacific pressure is the Southern Oscillation and the combined phenomenon is known as ENSO (El Niño-Southern Oscillation).
- Strong ENSO events produce large-scale climatic anomalies: increased rainfall in the eastern Pacific, drought in parts of Australia and India at times, and altered storm tracks elsewhere.
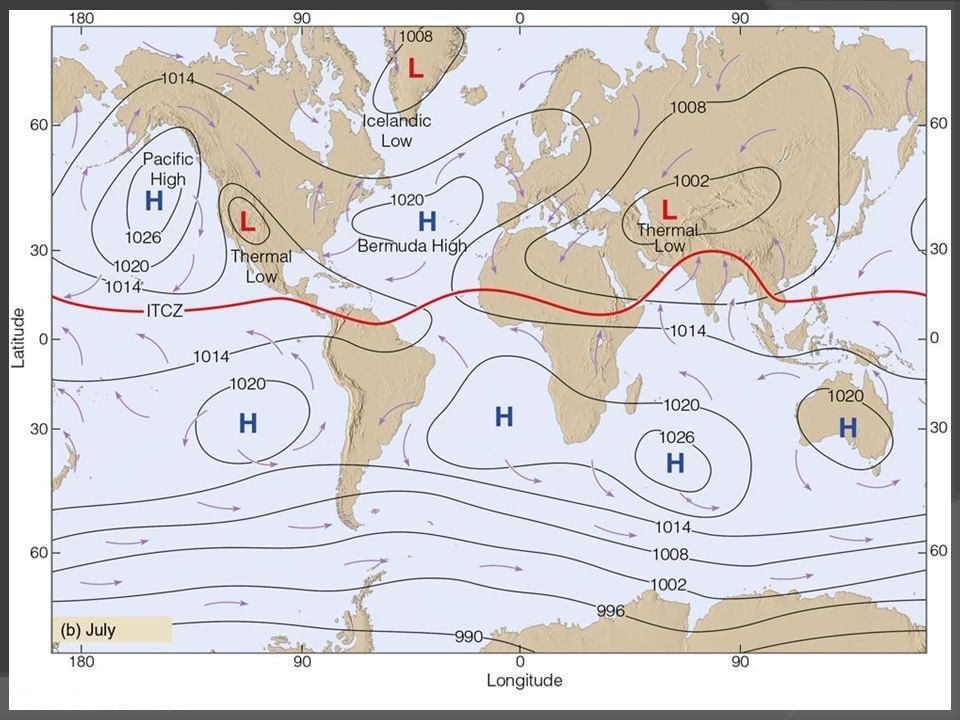
Seasonal Shift of Pressure Belts
Pressure Belts in July
- During the northern summer the apparent position of the Sun shifts north; the thermal equator (belt of maximum heating) moves north of the geographic equator and the pressure belts shift slightly northward.
- This seasonal displacement is particularly important for monsoon circulation systems and regional climate.
Pressure Belts in January
- During the northern winter the thermal equator shifts south and the global pressure belts shift south of their annual mean positions; the opposite occurs in the southern hemisphere.
- The seasonal shift is generally smaller in the southern hemisphere because of the greater ocean area which moderates temperature extremes.
- Continental and oceanic differences also affect seasonal pressure: in winter continents cool faster than oceans and tend to form high-pressure centres; in summer continents heat up and form low-pressure centres, while oceans respond more slowly.
Applications and Relevance
- Weather forecasting: Knowledge of pressure belts and their shifts is fundamental to predicting monsoons, storm tracks, and seasonal rainfall anomalies (including ENSO impacts).
- Civil engineering: Long-term patterns of prevailing winds and seasonal pressure systems inform the design of structures for wind loads, siting of buildings and infrastructure, drainage design, and assessment of coastal upwelling/erosion risks.
- Electrical engineering: Atmospheric pressure and associated humidity and aerosol conditions affect insulation performance, radio wave propagation and some high-voltage corona and discharge phenomena.
- Computer science and data science: Numerical weather prediction, climate modelling and ENSO forecasting rely on processing large-scale pressure, temperature and wind datasets; understanding the physical basis of pressure belts helps design and validate models.
Summary
The global system of pressure belts-formed by thermal heating, the Earth's rotation and moisture distribution-organises the major wind systems, rainfall zones and climatic regions of the world. Understanding how pressure varies vertically and horizontally, how the three-cell circulation and the Walker circulation operate, and how pressure belts shift seasonally is essential for weather forecasting, climate studies and applied engineering disciplines.
FAQs on Pressure Belts of the Earth
| 1. What are pressure systems? |  |
| 2. How do pressure belts control weather patterns? | |
| 3. What are the world pressure belts? | |
| 4. How do pressure belts vary in different months? | |
| 5. How do pressure belts affect wind patterns? | |


