GATE Past Year Questions: Production Planning | Industrial Engineering - Mechanical Engineering PDF Download

Q1: A set of jobs U, V, W, X, Y, Z arrive at time t = 0 to a production line consisting of two workstations in series. Each job must be processed by both workstations in sequence (i.e. the first followed by the second). The process times (in minutes) for each job on each workstation in the production line are given below.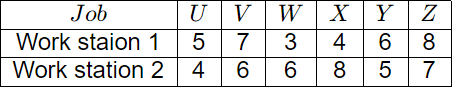
The sequence in which the jobs must be processed by the production line if the total make span of production is to be minimized is [GATE ME 2024]
(a) W-X-Z-V-Y-U
(b) W-X-V-Z-Y-U
(c) W-U-Z-V-Y-X
(d) U-Y-V-Z-X-W
Ans: (a)
By J ohnson's rule of sequencing mark minimum time consuming operation for each process.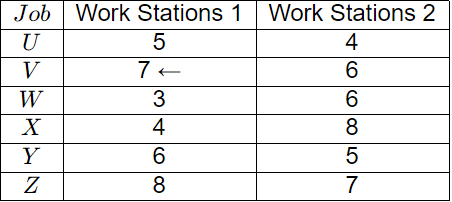 According to question, work on work station (1) is followed by work on workstation (2).
Perform that job in mark station which is minimum time consumption.
It is W-X during this Z on work station-2 will be performed.
So, W - X - Z
After W − X − Z, V, will be performed on workstation (1).
So, W − X − Z − V, in between Y-work on workstation will perform.
As minimum time in workstation is U, so will be performed at last.
So, W - X - Z - V - Y - U
Q1: A machine produces a defective component with a probability of 0.015. The number of defective components in a packed box containing 200 components produced by the machine follows a Poisson distribution. The mean and the variance of the distribution are [GATE ME 2023]
(a) 3 and 3, respectively
(b) √3 and √3 , respectively
(c) 0.015 and 0.015, respectively
(d) 3 and 9, respectively
Ans: (a)
P = 0.015
n = 200
mean = λ = np = 200 × 0.015 = 3
variance = σ2 = λ = 3
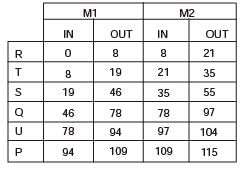
Q1: Parts P1-P7 are machined first on a milling machine and then polished at a separate machine. Using the information in the following table, the minimum total completion time required for carrying out both the operations for all 7 parts is __________ hours. [GATE ME 2022 SET-2]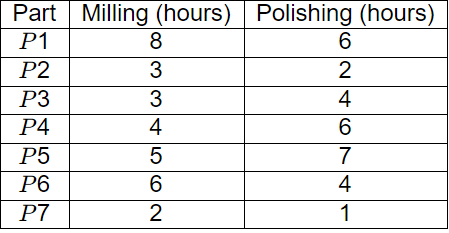 (a) 31
(b) 33
(c) 30
(d) 32
Ans: (b)
Sequencing model :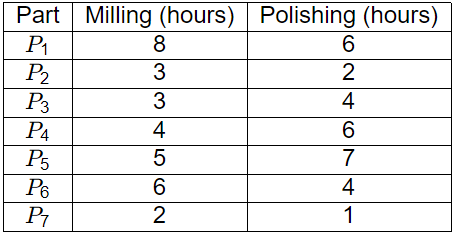 Optimum job sequence (According to Johnson's algorithm)
P3, P4, P5, P1, P6, P2, P7
Optimum Make-span (Minimum total completion time)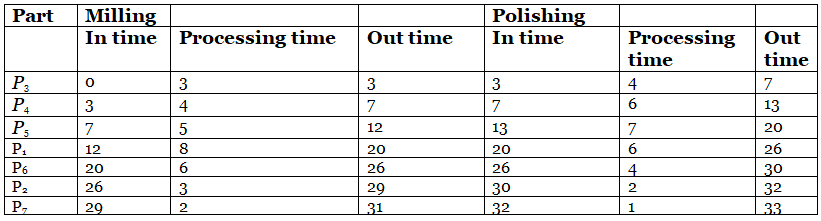 Minimum total completion time of all parts = 33 hours
Q2: An electric car manufacturer underestimated the January sales of car by 20 units, while the actual sales was 120 units. If the manufacturer uses exponential smoothing method with a smoothing constant of α = 0.2, then the sales forecast for the month of February of the same year is _______units (in integer). [GATE ME 2022 SET-2]
Ans: 104 to 104
Actual sales in Jan (DJan) = 120 units
Under estimate in Jan = DJan − FJan = 20
DJan = 100 units
Smoothing constant (α = 0.2)
Forecast for Feb (DJan) = ?
FFeb = FJan + α(DJan − FJan) = 100 + 0.2(120 − 100) = 104 units
Q1: The demand and forecast of an item for five months are given in the table.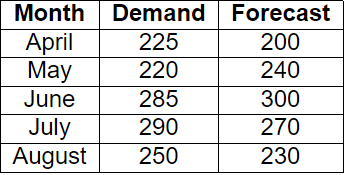
The Mean Absolute Percent Error (MAPE) in the forecast is _______% (round off to two decimal places) [GATE ME 2021 SET-2]
Ans: 6 to 10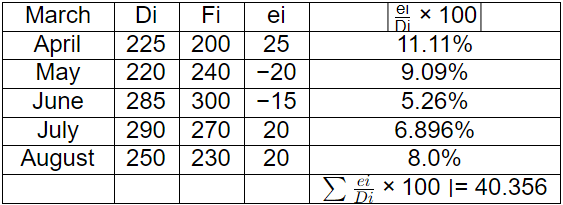 MAPE =
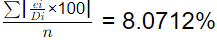
Q2: Daily production capacity of a bearing manufacturing company is 30000 bearings. The daily demand of the bearing is 15000. The holding cost per year of keeping a bearing in the inventory is Rs. 20. The setup cost for the production of a batch is Rs. 1800. Assuming 300 working days in a year, the economic batch quantity in number of bearings is ______ (in integer). [GATE ME 2021 SET-2]
Ans: 40200 to 40300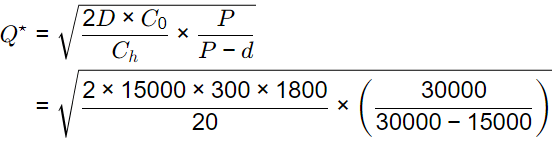
= 40249.2 ≃ 40250 units
Q1: The forecast for the monthly demand of a product is given in the table below.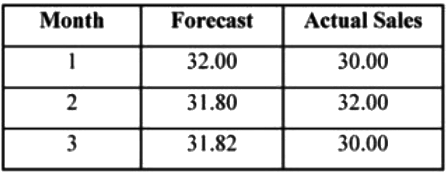 The forecast is made by using the exponential smoothing method. The exponential smoothing coefficient used in forecasting the demand is [GATE ME 2020 SET-2]
(a) 0.1
(b) 0.4
(c) 0.5
(d) 1
Ans: (a)
Ft = Ft−1 + α(Dt−1 − Ft−1)
For 2nd month Ft = 31.8, for 1st month
Ft−1 = 32 and Dt−1 = 30
31.8 = 32 + α(30 - 32)
2α = 32 - 31.8
α = 0.1
Q2: In Materials Requirement Planning, if the inventory holding cost is very high and the setup cost is zero, which one of the following lot sizing approaches should be used? [GATE ME 2020 SET-2]
(a) Economic Order Quantity
(b) Lot-for-Lot
(c) Base Stock Level
(d) Fixed Period Quantity, for 2 periods
Ans: (b)
In Lot-for-lot, holding cost is high and ordering cost is less.
[2017]
[2015]
[2012]
[2011 : 1 Mark]
[2010]
[2008]
[2007]
[2006]
[2006]
[2005]
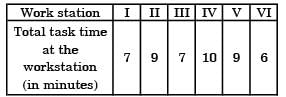
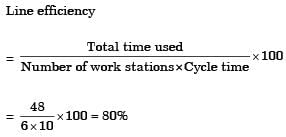
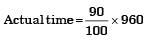
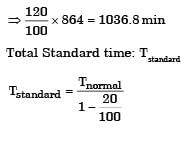
 Standard Production rate =
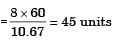
[2004]
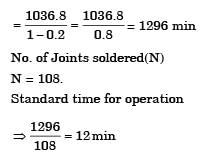
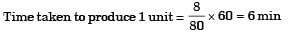 T = 6 min
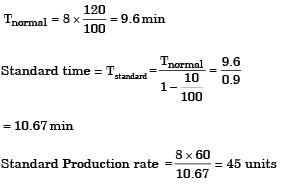
[2004]
[2004]
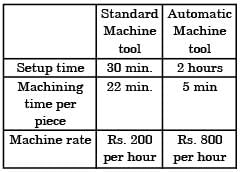
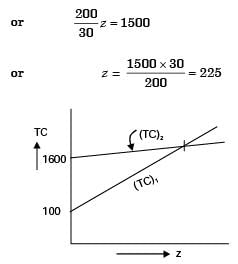
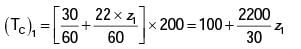 Total cost of z2 component by using Automatic Machine tool,
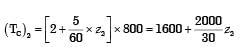 Let break even point be z number of components
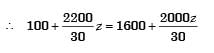
[2003]
[2001]
[1995]
|
30 videos|64 docs|30 tests
|
FAQs on GATE Past Year Questions: Production Planning - Industrial Engineering - Mechanical Engineering
| 1. What is Production Planning in Mechanical Engineering? |  |
| 2. What are the main objectives of Production Planning? | |
| 3. What are the types of Production Planning methods commonly used? | |
| 4. How does Production Planning impact overall manufacturing efficiency? | |
| 5. What role does technology play in Production Planning? | |


Previous Year Questions with Solutions
,GATE Past Year Questions: Production Planning | Industrial Engineering - Mechanical Engineering
,video lectures
,Objective type Questions
,Extra Questions
,Important questions
,Exam
,ppt
,study material
,Free
,Semester Notes
,Sample Paper
,practice quizzes
,mock tests for examination
,Viva Questions
,shortcuts and tricks
,MCQs
,GATE Past Year Questions: Production Planning | Industrial Engineering - Mechanical Engineering
,past year papers
,GATE Past Year Questions: Production Planning | Industrial Engineering - Mechanical Engineering
,Summary
;


GATE Past Year Questions: Production Planning Free PDF Download
Importance of GATE Past Year Questions: Production Planning
GATE Past Year Questions: Production Planning Notes
GATE Past Year Questions: Production Planning Mechanical Engineering
Study GATE Past Year Questions: Production Planning on the App
|
© EduRev
|
Education Revolution
|


|


within 7 days!