Ex 4.3 NCERT Solutions - Linear Equations in Two Variables - Class 9 PDF Download

Q.1. Draw the graph of each of the following linear equations in two variables:
(i) x + y = 4
(ii) x – y = 2
(iii) y = 3x
(iv) 3 = 2x + y
Ans. (i) x + y= 4 ⇒ y = 4 – x
If we have x = 0, then y = 4 – 0 = 4
If we have x = 1, then y = 4 – 1 = 3
If we have x = 2, then y = 4 – 2 = 2
∴ We get the following table: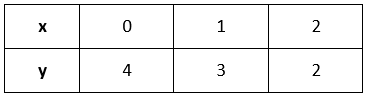 Plot the ordered pairs (0, 4), (1, 3) and (2, 2) on the graph paper. Joining these points, we get a line AB as shown below.
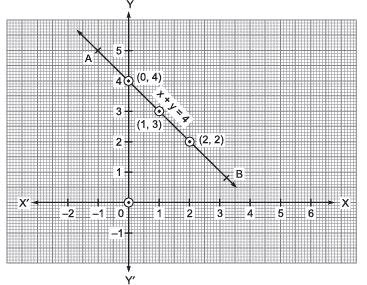 Thus, the line AB is the required graph of x + y = 4.
(ii) x – y = 2 ⇒ y = x – 2
If we have x = 0, then y = 0 – 2 = – 2
If we have x = 1, then y = 1 – 2 = – 1
If we have x = 2, then y = 2 – 2 = 0
∴ We have the following table:
Plot the ordered pairs (0, –2), (1, –1) and (2, 0) on the graph paper. Joining these points, we get a straight line PQ as shown below:
Thus, the line PQ is required graph of x – y = 2.
(iii) y = 3x
If x = 0, then y = 3(0) ⇒ y = 0
If x = 1, then y = 3(1) ⇒ y = 3
If x = –1, then y = 3( – 1) ⇒ y = – 3
∴ We get the following table: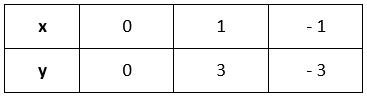 Plot the ordered pairs (0, 0), (1, 3) and (–1, –3) on the graph paper. Joining these points, we get the straight line LM.
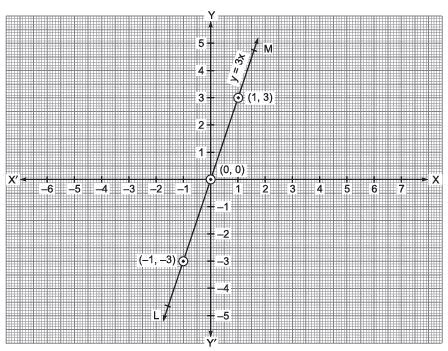 Thus, LM is the required graph of y = 3x.
Note:
The graph of the equation of the form y = kx is a straight line which always passes through the origin.
(iv) 3 = 2x + y ⇒ y = 3 – 2x
If x = 0, then y = 3 – 2(0) ⇒ y = 3
If x = 1, then y = 3 – 2(1) ⇒ y = 1
If x = 2, then y = 3 – 2(2) ⇒ y = –1
∴ We get the following table: 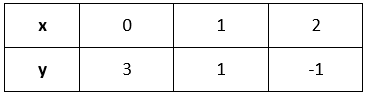 Plot the ordered pairs (0, 3), (1, 1) and (2, –1) on the graph paper. Joining these points, we get a line CD.
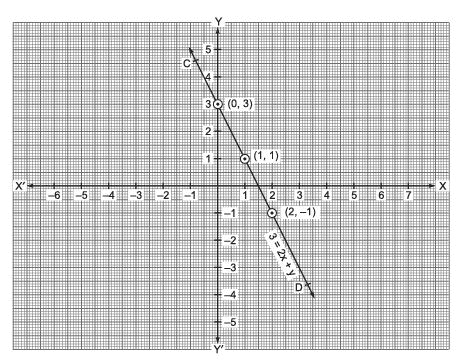 Thus, the line CD is the required graph of 3 = 2x + y.
Q.2. Give the equations of two lines passing through (2, 14). How many more such lines are there, and why?
Ans. (2, 14) means x = 2 and y = 14
Following equations can have (2, 14) as the solution, i.e. they can pass through the point (2, 14).
(i) x + y = 16
(ii) 7x – y = 0
There can be an unlimited number of lines that can pass through the point (2, 14) because an unlimited number of lines can pass through a point.
Q.3. If the point (3, 4) lies on the graph of the equation 3y = ax + 7, find the value of a.
Ans. The equation of the given line is 3y = ax + 7
∵ (3, 4) lies on the given line.
∴ It must satisfy the equation 3y = ax + 7
We have (3, 4) ⇒ x = 3 and y = 4
L.H.S.: 3y = 3 * 4 = 12
R.H.S.: ax + 7 = a * 3 + 7 = 3a + 7
∵ L.H.S. = R.H.S.
∴ 12 = 3a + 7 ⇒ 3a = 12 – 7 = 5 ⇒ a = (5/3)
Thus, the required value of a is (5/3)
Q.4. The taxi fare in a city is as follows: For the first kilometre, the fare is ₹ 8 and for the subsequent distance it is ₹ 5 per km. Taking the distance covered as x km and total fare as ₹ y, write a linear equation for this information and draw its graph.
Ans. Total distance covered = x km, Total taxi fare = ₹ y
Fare for the 1st km = ₹ 8
Remaining distance = (x – 1) km
∴ Fare for (x – 1) km = ₹ 5 * (x – 1) km
Total taxi fare = ₹ 8 + ₹ 5(x – 1)
∴ According to the condition,
y = 8 + 5(x – 1) ⇒ y = 8 + 5x – 5 ⇒ y = 5x + 3
i.e. Required linear equation representing the given information.
Graph: We have y = 5x + 3
When x = 0, y = 5(0) + 3 ⇒ y = 3
When x = – 1, y = 5(– 1) + 3 ⇒ y = – 2
When x = – 2, y = 5(– 2) + 3 ⇒ y = – 7
∴ We get the following table: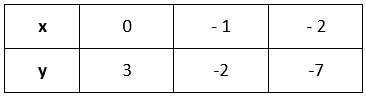
Now, plotting the ordered pairs (0, 3), (–1, –2) and (–2, –7) on a graph paper and joining them, we get a straight line PQ.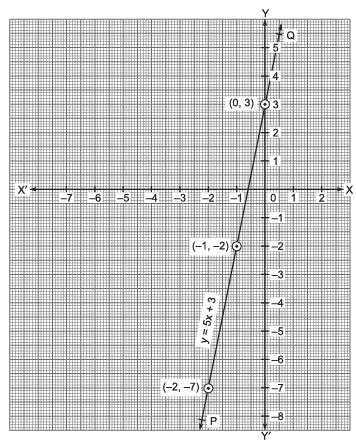
Thus, PQ is the required graph of the linear equation y = 5x + 3.
Q.5. From the choices given below, choose the equation whose graphs are given in Fig. (i) and Fig. (ii).
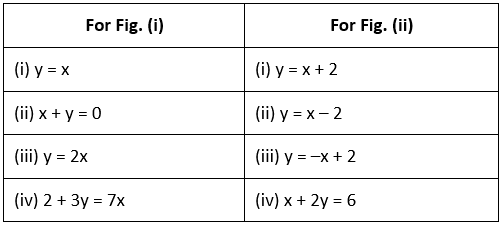
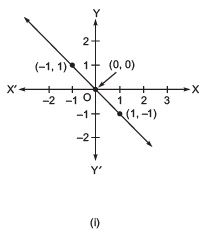
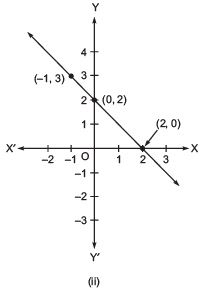 Ans. For Fig. (i), the correct linear equation is x + y = 0
∵ (–1, 1) ⇒ –1 + 1 = 0 and (1, –1) ⇒ 1 + (–1) = 0
For Fig.(ii), the correct linear equation is y = – x + 2
∵ (–1, 3) ⇒ 3 = –(–1) + 2 ⇒ 3 = 3 and (0, 2) ⇒ 2 = –(0) + 2 ⇒ 2 = 2
Q.6. If the work done by a body on the application of a constant force is directly proportional to the distance travelled by the body, express this in the form of an equation in two variables and draw the graph of the same by taking the constant force as 5 units. Also read from the graph the work done when the distance travelled by the body is
(i) 2 units (ii) 0 unit
Ans. Constant force is 5 units.
Let the distance travelled = x units and work done = y units.
Since, Work done = Force x Displacement ⇒ y= 5 * x ⇒ y= 5x
Drawing the graph, We have y = 5x
When x = 0, then y = 5(0) = 0
When x = 1, then y = 5(1) = 5
When x = 1.5, then y = 5(1.5) = 7.5
∴ We get the following table: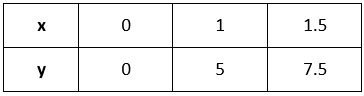
Plotting the ordered pairs (0, 0), (1, 5), and (1.5, 7.5) on the graph paper and joining the points, we get a straight line OB.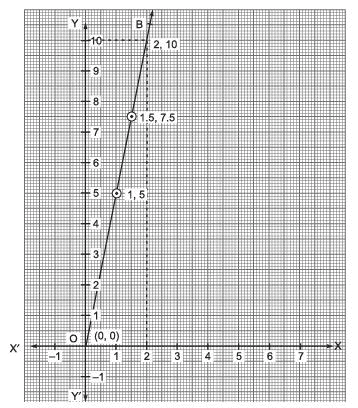 From the graph, we get
(i) Distance travelled = 2 units
∴ x = 2, then y = 10 units ⇒ Work done = 10 units.
(ii) Distance travelled = 0 units
∴ y = 5x ⇒ y = 5(0) = 0
∴ Work done = 0 unit.
Q.7. Yamini and Fatima, two students of Class IX of a school, together contributed ₹ 100 towards the Prime Minister’s Relief Fund to help the earthquake victims. Write a linear equation that satisfies this data. (You may take their contributions as ₹ x and ₹ y.) Draw the graph of the same.
Ans. Let the contribution of Yamini = ₹ x and the contribution of Fatima = ₹ y
∴ We have x + y = 100 ⇒ y = 100 – x
If x = 0, y = 100 – 0 = 100
If x = 50, y = 100 – 50 = 50
If x = 100, y = 100 – 100 = 0
We get the following table: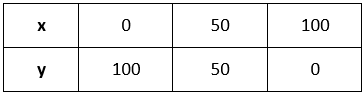
For drawing the graph, plot the ordered pairs (0, 100), (50, 50), and (100, 0) on graph paper.
Joining these points, we get a line PQ.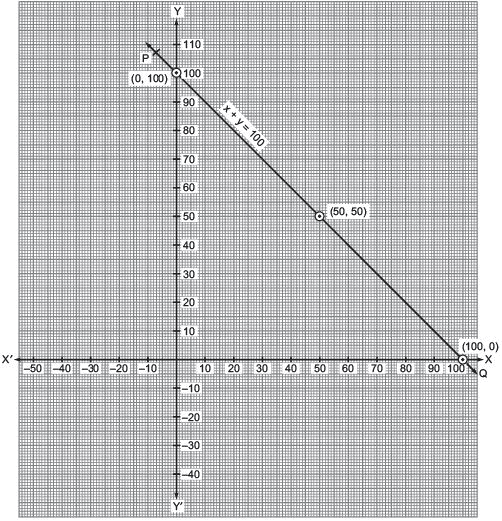 Thus, PQ is the required graph of x + y = 100.
Q.8. In countries like the USA and Canada, the temperature is measured in Fahrenheit, whereas in countries like India, it is measured in Celsius. Here is a linear equation that converts Fahrenheit to Celsius.
F= (9/5)C + 32
(i) Draw the graph of the linear equation above using Celsius for the x-axis and Fahrenheit for the y-axis.
(ii) If the temperature is 30ºC, what is the temperature in Fahrenheit?
(iii) If the temperature is 95ºF, what is the temperature in Celsius?
(iv) If the temperature is 0ºC, what is the temperature in Fahrenheit and if the temperature is 0ºF, what is the temperature in Celsius?
(v) Is there a temperature which is numerically the same in both Fahrenheit and Celsius? If yes, find it.
Ans.
(i) We have 
When C = 0, 
When C = –15, 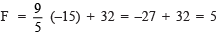
When C = –10, 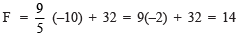
We have the following table: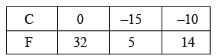 Plot the ordered pairs (0, 32), (–15, 5), and (–10, 14) on graph paper.
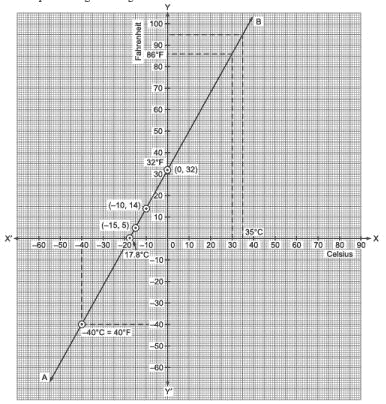 Joining these points, we get a straight line AB.
(ii) From the graph, we have 86ºF corresponds to 30ºC
(iii) From the graph, we have 95ºF = 35ºC
(iv) From the graph, we have 0ºC = 32ºF and 0ºF = 17.8ºC
(v) Yes, from the graph, we have 40ºF = – 40ºC

Viva Questions
,Ex 4.3 NCERT Solutions - Linear Equations in Two Variables - Class 9
,Important questions
,shortcuts and tricks
,video lectures
,Ex 4.3 NCERT Solutions - Linear Equations in Two Variables - Class 9
,Free
,Semester Notes
,Objective type Questions
,Ex 4.3 NCERT Solutions - Linear Equations in Two Variables - Class 9
,study material
,Previous Year Questions with Solutions
,Extra Questions
,Sample Paper
,MCQs
,ppt
,mock tests for examination
,past year papers
,Summary
,Exam
,practice quizzes
;


Ex 4.3 NCERT Solutions - Linear Equations in Two Variables Free PDF Download
Importance of Ex 4.3 NCERT Solutions - Linear Equations in Two Variables
Ex 4.3 NCERT Solutions - Linear Equations in Two Variables Notes
Ex 4.3 NCERT Solutions - Linear Equations in Two Variables Class 9 Questions
Study Ex 4.3 NCERT Solutions - Linear Equations in Two Variables on the App
|
© EduRev
|
Education Revolution
|


|


