Civil Engineering (CE) Exam > Civil Engineering (CE) Notes > Engineering Hydrology > Precipitation & Its Measurement
Precipitation & Its Measurement | Engineering Hydrology - Civil Engineering (CE) PDF Download

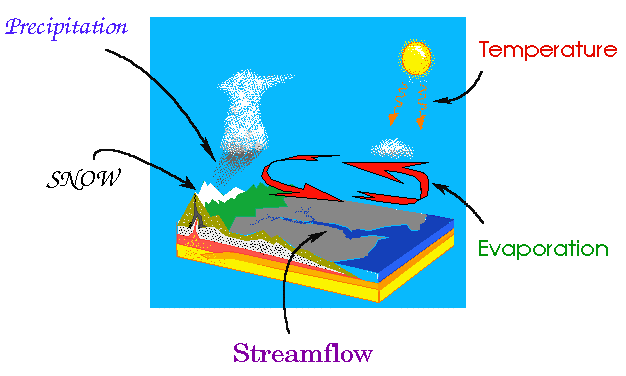
Precipitation & General aspects of Hydrology
- Index of Wetness
(i) Index of wetness = (rainfall in a given year at a given place /average annual rainfall of that place) x 100
(ii) % Rain deficiency = 100 - % index of wetness - Aridity index
A.I = (PET - AET / PET) x 100
Where, A.I = Aridity index
PET = Potential Evapo- transpiration
AET = Actual Evapotranspiration
(i) AI ≤ 0 → Nonarid
(ii) 1 ≤ A.I ≤ 25 → Mild Arid
(iii) 26 ≤ A.I ≤ 50 → Moderate arid
(iv) A.I > 50 → Severe Arid - Optimum Number of rain Gauge: (N)
N = (CV / ∈)2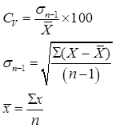
where, Cv = Coefficient of variation,
∈ = Allowable % Error,
σ Standard deviation of the data, n = Number of stations, mean of rainfall value
 - Estimation of missing rainfall data
(i)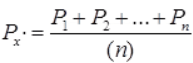
If N1, N2…Nn < 10% of Nx
where, N1, N2,…Nx..Nn are normal annual precipitation of 1, 2,…x…n respectively.
P1, P2…Pn are rainfall at station 1, 2,…. N respectively.
And Px is the rainfall of station x.
Case: A minimum number of three stations closed to station ‘x’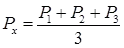
(ii)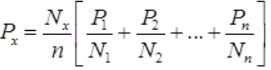
If any of N1, N2, N3…
Nn > 10% of Nx - Mean rainfall Data
To convert the point rainfall values at various into an average value over a catchment the following three methods are in use:
(i) Arithmetic Avg Method: when the rainfall measured at various stations in a catchment area is taken as the arithmetic mean of the station values.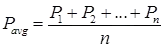
Where, P1, P2…Pn are rainfall values
Of stations 1, 2…n respectively.
In practice this method is used very rerely.
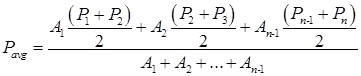
(ii) Thiessen Polygon Method: in this method the rainfall recorded at each station is given a weightage on the basis of an area closest to the station.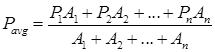
Where, P1, P2…Pn are the rainfall data of areas A1, A2…An. The thiessen-polygon method of calculating the average precipitation over an area is superior to the arithmetic average method.
(iii) Isohyetal Method: An isohyet is a line joining points of equal rainfall magnitude. The recorded values for which areal average P is to be determined are then maked on the plot at appropirate stations. Neighbouring stations outside the catchment are also considered.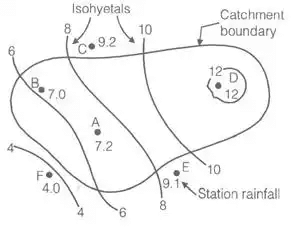
The document Precipitation & Its Measurement | Engineering Hydrology - Civil Engineering (CE) is a part of the Civil Engineering (CE) Course Engineering Hydrology.
All you need of Civil Engineering (CE) at this link: Civil Engineering (CE)
|
20 videos|53 docs|30 tests
|
FAQs on Precipitation & Its Measurement - Engineering Hydrology - Civil Engineering (CE)
| 1. What is precipitation and why is it important in hydrology? |  |
Ans. Precipitation refers to any form of water that falls from the atmosphere to the Earth's surface, such as rain, snow, sleet, or hail. It is an essential component of the hydrological cycle and plays a crucial role in hydrology as it replenishes water resources, including rivers, lakes, and groundwater. Precipitation also affects the distribution of water resources, influences weather patterns, and is a vital factor in climate studies and water resource management.
| 2. How is precipitation measured in hydrology? | |
Ans. Precipitation can be measured using various instruments and techniques in hydrology. The most common method is using rain gauges, which are devices that collect and measure the amount of rainfall at a specific location. Rain gauges can be either manual or automated, and they provide data on the depth or intensity of precipitation. Other methods include weather radar, satellite remote sensing, and ground-based sensors, which provide more comprehensive and spatially distributed precipitation data.
| 3. What factors can affect the measurement of precipitation in hydrology? | |
Ans. Several factors can influence the measurement of precipitation in hydrology. Some of these factors include wind, which can cause undercatch or overcatch in rain gauges, leading to inaccurate measurements. Evaporation can also affect the measurement, especially in areas with high temperatures or strong winds. The type of precipitation, such as snow or freezing rain, can pose challenges in measurement as well. Additionally, the location and placement of rain gauges can affect the representativeness of the measurements, as they need to be placed in open areas away from obstructions.
| 4. How is precipitation data used in hydrological modeling? | |
Ans. Precipitation data is a crucial input for hydrological modeling, which is used to simulate and predict the behavior of water in various hydrological systems. The data is used to estimate the amount of water entering the hydrological system through rainfall or snowfall. This information is then used to determine the runoff, soil moisture, groundwater recharge, and streamflow, which are important parameters in hydrological models. Precipitation data is also used to validate and calibrate the models, ensuring their accuracy and reliability.
| 5. How does precipitation contribute to flood forecasting and water resource management in hydrology? | |
Ans. Precipitation is a vital factor in flood forecasting and water resource management in hydrology. By monitoring and analyzing precipitation patterns, hydrologists can predict the likelihood and intensity of floods. Precipitation data is used to estimate the amount of water entering river systems, which helps in determining the response of rivers to rainfall events. This information is crucial for issuing flood warnings, implementing flood control measures, and managing water resources effectively. Precipitation data is also used to assess drought conditions, plan water allocation, and support decision-making processes in water resource management.
About this Document

4.98/5
Rating

Sep 22, 2025
Last updated
Related Exams
Document Description: Precipitation & Its Measurement for Civil Engineering (CE) 2025 is part of Engineering Hydrology preparation.
The notes and questions for Precipitation & Its Measurement have been prepared according to the Civil Engineering (CE) exam syllabus. Information about Precipitation & Its Measurement covers topics
like Precipitation & General aspects of Hydrology and Precipitation & Its Measurement Example, for Civil Engineering (CE) 2025 Exam. Find important definitions, questions, notes, meanings, examples, exercises and tests below for Precipitation & Its Measurement.
Introduction of Precipitation & Its Measurement in English is available as part of our Engineering Hydrology
for Civil Engineering (CE) & Precipitation & Its Measurement in Hindi for Engineering Hydrology course.
Download more important topics related with notes, lectures and mock test series for Civil Engineering (CE)
Exam by signing up for free. Civil Engineering (CE): Precipitation & Its Measurement | Engineering Hydrology - Civil Engineering (CE)
Description
Full syllabus notes, lecture & questions for Precipitation & Its Measurement | Engineering Hydrology - Civil Engineering (CE) - Civil Engineering (CE) | Plus excerises question with solution to help you revise complete syllabus for Engineering Hydrology | Best notes, free PDF download
Information about Precipitation & Its Measurement
In this doc you can find the meaning of Precipitation & Its Measurement defined & explained in the simplest way possible. Besides explaining types of
Precipitation & Its Measurement theory, EduRev gives you an ample number of questions to practice Precipitation & Its Measurement tests, examples and also practice Civil Engineering (CE)
tests

Related Searches
Objective type Questions
,shortcuts and tricks
,past year papers
,Semester Notes
,practice quizzes
,MCQs
,Exam
,mock tests for examination
,Summary
,ppt
,Free
,Extra Questions
,Viva Questions
,Precipitation & Its Measurement | Engineering Hydrology - Civil Engineering (CE)
,Precipitation & Its Measurement | Engineering Hydrology - Civil Engineering (CE)
,study material
,Precipitation & Its Measurement | Engineering Hydrology - Civil Engineering (CE)
,Previous Year Questions with Solutions
,video lectures
,Important questions
,Sample Paper
;


Additional Information about Precipitation & Its Measurement for Civil Engineering (CE) Preparation
Precipitation & Its Measurement Free PDF Download
The Precipitation & Its Measurement is an invaluable resource that delves deep into the core of the Civil Engineering (CE) exam.
These study notes are curated by experts and cover all the essential topics and concepts, making your preparation more efficient and effective.
With the help of these notes, you can grasp complex subjects quickly, revise important points easily,
and reinforce your understanding of key concepts. The study notes are presented in a concise and easy-to-understand manner,
allowing you to optimize your learning process. Whether you're looking for best-recommended books, sample papers, study material,
or toppers' notes, this PDF has got you covered. Download the Precipitation & Its Measurement now and kickstart your journey towards success in the Civil Engineering (CE) exam.
Importance of Precipitation & Its Measurement
The importance of Precipitation & Its Measurement cannot be overstated, especially for Civil Engineering (CE) aspirants.
This document holds the key to success in the Civil Engineering (CE) exam.
It offers a detailed understanding of the concept, providing invaluable insights into the topic.
By knowing the concepts well in advance, students can plan their preparation effectively.
Utilize this indispensable guide for a well-rounded preparation and achieve your desired results.
Precipitation & Its Measurement Notes
Precipitation & Its Measurement Notes offer in-depth insights into the specific topic to help you master it with ease.
This comprehensive document covers all aspects related to Precipitation & Its Measurement.
It includes detailed information about the exam syllabus, recommended books, and study materials for a well-rounded preparation.
Practice papers and question papers enable you to assess your progress effectively.
Additionally, the paper analysis provides valuable tips for tackling the exam strategically.
Access to Toppers' notes gives you an edge in understanding complex concepts.
Whether you're a beginner or aiming for advanced proficiency, Precipitation & Its Measurement Notes on EduRev are your ultimate resource for success.
Precipitation & Its Measurement Civil Engineering (CE) Questions
The "Precipitation & Its Measurement Civil Engineering (CE) Questions" guide is a valuable resource for all aspiring students preparing for the
Civil Engineering (CE) exam. It focuses on providing a wide range of practice questions to help students gauge
their understanding of the exam topics. These questions cover the entire syllabus, ensuring comprehensive preparation.
The guide includes previous years' question papers for students to familiarize themselves with the exam's format and difficulty level.
Additionally, it offers subject-specific question banks, allowing students to focus on weak areas and improve their performance.
Study Precipitation & Its Measurement on the App
Students of Civil Engineering (CE) can study Precipitation & Its Measurement alongwith tests & analysis from the EduRev app,
which will help them while preparing for their exam. Apart from the Precipitation & Its Measurement,
students can also utilize the EduRev App for other study materials such as previous year question papers, syllabus, important questions, etc.
The EduRev App will make your learning easier as you can access it from anywhere you want.
The content of Precipitation & Its Measurement is prepared as per the latest Civil Engineering (CE) syllabus.
|
© EduRev
|
Education Revolution
|


|


Signup to see your scores
go up
within 7 days!
within 7 days!
Takes less than 10 seconds to signup