Human Geography: Population | Geography for UPSC CSE PDF Download
Basic Terms Related to Population & Growth
Population Growth
Population growth or population change refers to the change in the number of inhabitants of territory during a specific period of time.
- This change may be positive as well as negative.
- Population change in an area is an important indicator of the economic development, social upliftment, and historical and cultural background of the region.
Growth Rate of Population
This is the change of population expressed in percentage.
- Population in the world is currently (2020) growing at a rate of around 1.05% per year (down from 1.08% in 2019, 1.10% in 2018, and 1.12% in 2017). The current average population increase is estimated at 81 million people per year.
Natural Growth of Population
Natural population increase happens as people are born into a country, and decrease as people die.
- Natural population increase is a positive natural change when the number of live births is larger than the number of deaths during the time period considered.
- Natural population decrease is the opposite, a negative natural change when the number of deaths exceeds the number of births.
- Natural Growth = Births — Deaths
- It is the Actual Growth of Population
- Births — Deaths + In Migration — Out Migration
Positive Growth of Population
This happens when the birth rate is more than the death rate between two points of time or when people from other countries migrate permanently to a region.
- A positive growth rate indicates that the population is increasing, while a negative growth rate indicates that the population is decreasing
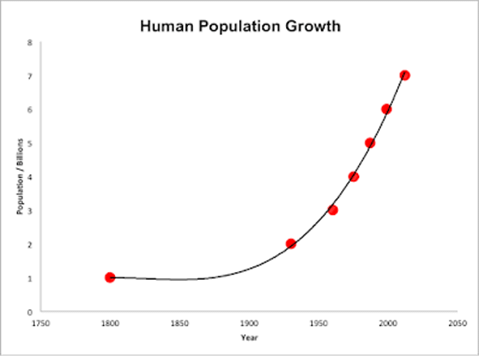 Graph of Positive Growth
Negative Growth of Population
If the population decreases between two points of time it is known as negative growth of population.
- It occurs when the birth rate falls below the death rate or people migrate to other countries.
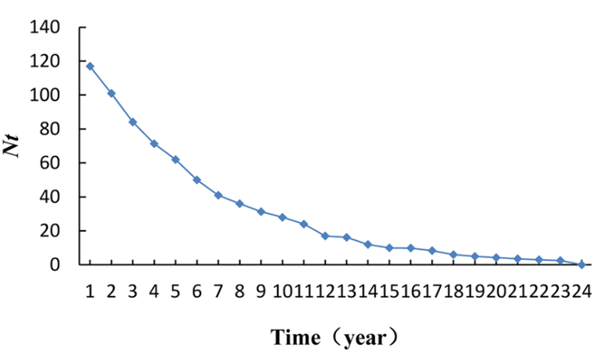 Graph showing Negative Growth of Population
Patterns of Population
The term population distribution refers to the way people are spaced over the earth’s surface.
- Broadly, 90 percent of the world population lives in about 10 percent of its land area.
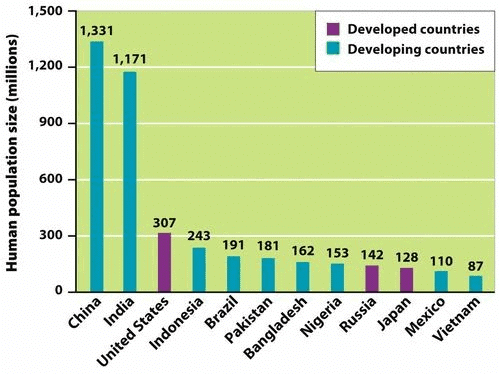
- The 10 most populous countries of the world contribute about 60 percent of the world’s population.
- Of these 10 countries, 6 are located in Asia.
Density of Population
It is the ratio between the numbers of people to the size of land.
- It is usually measured in persons per sq km.
- Commonly this may be calculated for a county, city, country, another territory or the entire world.
Factors influencing the Distribution of Population
Geographical Factors
Availability of water
- People prefer to live in areas where freshwater is easily available.
- It is because of this that river valleys are among the most densely populated areas of the world.
Landforms
- People prefer living on flat plains and gentle slopes.
- This is because such areas are favorable for the production of crops and to build roads and industries.
- The mountainous and hilly areas hinder the development of transport networks and hence initially do not favor agricultural and industrial development. So, these areas tend to be less populated.
- The Ganga plains are among the most densely populated areas of the world while the mountain zones in the Himalayas are scarcely populated.
Climate
- An extreme climate such as very hot or cold deserts is uncomfortable for human habitation.
- Areas with a comfortable climate, where there is not much seasonal variation attract more people.
- Areas with very heavy rainfall or extreme and harsh climates have low population.
- Mediterranean regions were inhabited from early periods in history due to their pleasant climate.
Soils
- Areas that have fertile loamy soils have more people living on them as these can support intensive agriculture.
Economic Factors
Minerals
- Areas with mineral deposits attract industries.
- Mining and industrial activities generate employment.
- So, skilled and semi-skilled workers move to these areas and make them densely populated.
- Katanga Zambia copper belt in Africa is one such good example.
Urbanization
- Good civic amenities and better employment opportunities draw people to the cities.
- It leads to rural to urban migration and cities grow in size.
Industrialization
- Industrial belts provide job opportunities and attract large numbers of people.
- The Kobe-Osaka region of Japan is thickly populated because of the presence of a number of industries.
Social and Cultural Factors
- Some places attract more people because they have religious or cultural significance.
- In the same way — people tend to move away from places where there is social and political unrest.
Components of Population Change
- There are three components of population change — births, deaths and migration.
- The crude birth rate (CBR) is expressed as the number of live births in a year per thousand of population.
- Crude Death Rate (CDR) is expressed in terms of the number of deaths in a particular year per thousand of the population in a particular region.
1. Migration
- Apart from birth and death, there is another way by which the population size changes.
- When people move from one place to another, the place they move from is called the Place of Origin, and the place they move to is called the Place of Destination.
- The place of origin shows a decrease in population while the population increases in the place of destination.
Migration may be permanent, temporary, or seasonal:
- Immigration: Migrants who move into a new place are called Immigrants.
- Emigration: Migrants who move out of a place are called Emigrants.
There are two sets of factors that influence migration:
1. The Push factors make the place of origin seem less attractive for reasons like unemployment, political turmoil, unpleasant climate, natural disasters, epidemics, socio-economic backwardness, etc.
2. The Pull factors make the place of destination seem more attractive than the place of origin for reasons like better job opportunities and living conditions, peace and stability, security of life, pleasant climate, etc.
2. Trends in population growth
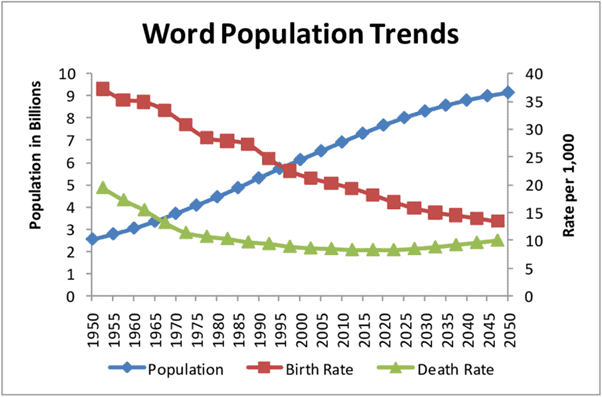
- The population on the earth is more than seven billion.
- It is only during the last few hundred years that the population has increased at an alarming rate.
3. Demographic Transition
- Demographic transition theory can be used to describe and predict the future population of any area.
- The theory tells us that the population of any region changes from high births and high deaths to low births and low deaths as society progresses from rural agrarian & illiterate to urban industrial and literate society.
- These changes occur in stages which are collectively known as the demographic cycle.
- The first stage has high fertility and high mortality because people reproduce more to compensate for the deaths due to epidemics and variable food supply.
- The population growth is slow and most of the people are engaged in agriculture.
- Fertility remains high at the beginning of the second stage, but it declines with time.
- Improvements in sanitation and health conditions lead to a decline in mortality.
- Because of this gap, the net addition to population is high.
- In the last stage, both fertility and mortality decline considerably.
- The population is either stable or grows slowly.
4. Population Composition
Sex composition
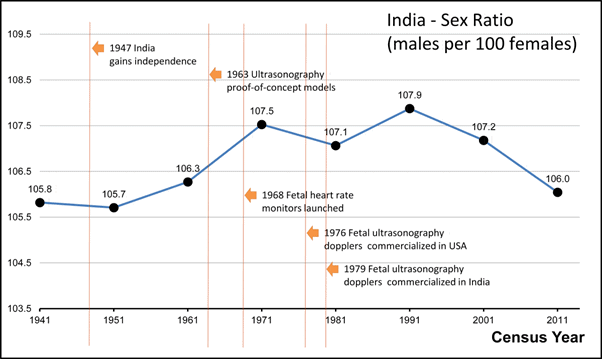
- The ratio between the number of women and men in the population is called the Sex Ratio.
- The sex ratio is important information about the status of women in a country.
- In regions where gender discrimination is rampant, the sex ratio is bound to be unfavorable to women.
- Such areas are those where the practice of female foeticide, female infanticide, and domestic violence against women is prevalent.
- One of the reasons could be the lower socio-economic status of women in these areas.
- You must remember that more women in the population do not mean they have a better status. It could be that the men might have migrated to other areas for employment.
- On average, the world population reflects a sex ratio of 102 males per 100 females.
- The highest sex ratio in the world has been recorded in Latvia where there are 85 males per 100 females.
- In contrast, in Qatar, there are 311 males per 100 females.
- The world pattern of sex ratio does not exhibit variations in the developed regions of the world.
- The sex ratio is favorable for females in 139 countries of the world and unfavorable for them in the remaining 72 countries listed by the United Nations.
- In general, Asia has a low sex ratio.
- Countries like China, India, Saudi Arabia, Pakistan, Afghanistan have a lower sex ratio.
- On the other extreme is the greater part of Europe (including Russia) where males are in minority.
- A deficit of males in the populations of many European countries is attributed to the better status of women, and an excessively male-dominated out-migration to different parts of the world in the past.
5. Age Structure
- Age structure represents the number of people of different age groups.
- This is an important indicator of population composition since a large size of the population in the age group of 15- 59 indicates a large working population.
- A greater proportion of the population above 60 years represents an aging population that requires more expenditure on health care facilities.
- Similarly, a high proportion of the young population would mean that the region has a high birth rate and the population is youthful.
Age-Sex Pyramid
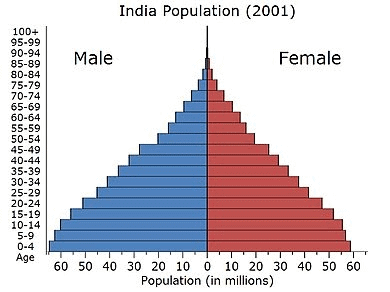
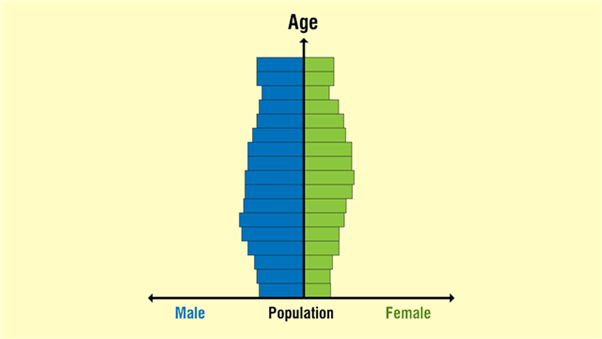
A population pyramid or "age-sex pyramid" is a graphical illustration of the distribution of a population by age groups and sex.
- A population pyramid is used to show the age-sex structure of the population.
- The shape of the population pyramid reflects the characteristics of the population.
- The left side shows the percentage of males while the right side shows the percentage of women in each age group.
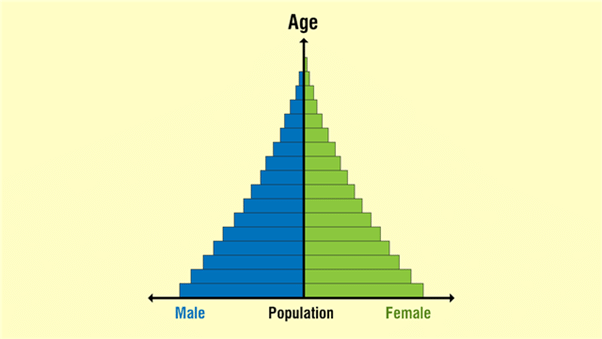
Age- Sex Pyramid of Expanding Population
The age-sex pyramid of Nigeria is a triangular-shaped pyramid with a wide base and is typical of less developed countries.
- These have larger populations in lower age groups due to high birth rates.
- If you construct the pyramids for Bangladesh and Mexico, it will look the same.
Age- Sex Pyramid of
Constant Population
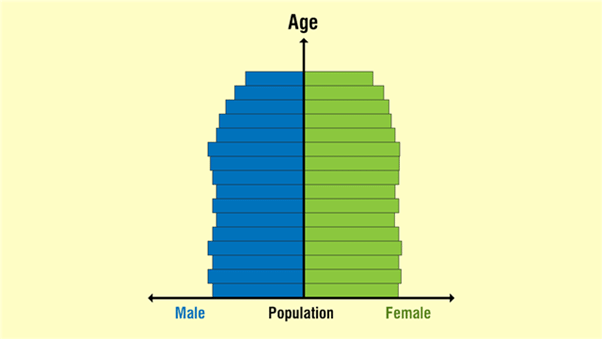
- Australia’s age-sex pyramid is bell-shaped and tapered towards the top.
- This shows birth and death rates are almost equal leading to a near-constant population.
Age- Sex Pyramid of
Declining Population
- The Japan pyramid has a narrow base and a tapered top showing low birth and death rates.
- The population growth in developed countries is usually zero or negative.
Ageing Population
Population ageing is the process by which the share of the older population becomes proportionally larger.
- This is a new phenomenon of the twentieth century.
- In most of the developed countries of the world, the population in higher age groups has increased due to increased life expectancy.
- With a reduction in birth rates, the proportion of children in the population has declined.
Rural-Urban Composition
The rural and urban differences in sex ratio in Canada and West European countries like Finland are just the opposite of those in African and Asian countries like Zimbabwe and Nepal respectively.
- In Western countries, males outnumber females in rural areas and females outnumber males in urban areas.
- In countries like Nepal, Pakistan and India the case is reversed.
- The excess of females in urban areas of the U.S.A., Canada, and Europe is the result of the influx of females from rural areas to avail of the vast job opportunities.
- Farming in these developed countries is also highly mechanized and remains largely a male occupation.
- By contrast, the sex ratio in Asian urban areas remains male-dominated due to the predominance of male migration.
- Also, in countries like India, female participation in farming activities in rural areas is fairly high.
- Shortage of housing, high cost of living, paucity of job opportunities and lack of security in cities, discourage women to migrate from rural to urban areas.
Occupational Structure
The working population (age group – 15 to 59) takes part in various occupations.
- Agriculture, forestry, fishing, and mining are classified as primary activities manufacturing as secondary, trade, transport, communication, and other services as tertiary, and the jobs related to research, information technology, and developing ideas as quaternary activities.
- The proportion of the working population engaged in these four sectors is a good indicator of the levels of economic development of a nation.
- This is because only a developed economy with industries and infrastructure can accommodate more workers in the secondary, tertiary, and quaternary sectors.
- If the economy is still in the primitive stages, then the proportion of people engaged in primary activities world be high as it involves the extraction of natural resources.
India Census 2011 Data and Observations
The India Census 2011 Data and Observations are summed up in the following points:
1. Uneven spatial distribution of population
- Population data are collected through a Census operation held every 10 years in our country.
- The first population Census in India was conducted in 1872 but its first complete Census was conducted only in 1881.
- It is clear that India has a highly uneven pattern of population distribution.
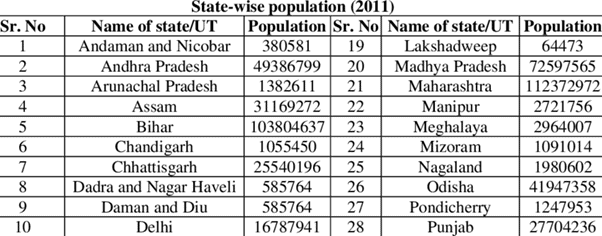
- Uttar Pradesh has the highest population followed by Maharashtra, Bihar and West Bengal.
- The share of the population is very small in the states like Jammu & Kashmir (1.04%), Arunachal Pradesh (0.11%) and Uttarakhand (0.84%) in spite of these states having fairly large geographical area.
- Such an uneven spatial distribution of population in India suggests a close relationship between population and physical, socioeconomic, and historical factors.
- As far as the physical factors are concerned, it is clear that climate along with terrain and availability of water largely determines the pattern of the population distribution.
- Consequently, we observe that the North Indian Plains, deltas, and Coastal Plains have a higher proportion of the population than the interior districts of southern and central Indian States, Himalayas, some of the northeastern and the western states.
- However, the development of irrigation (Rajasthan), availability of mineral and energy resources (Jharkhand), and development of transport network (Peninsular States) have resulted in moderate to the high concentration of population in areas which were previously very thinly populated.
- Among the socio-economic and historical factors, important ones are the evolution of settled agriculture; the pattern of human settlement; development of transport network, industrialization, and urbanization.
2. Density of Population
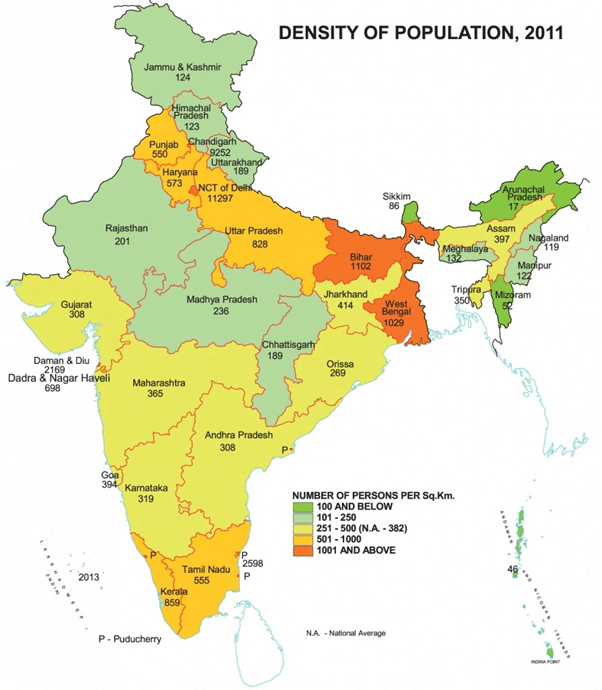
- There has been a steady increase of more than 200 persons per sq km over the last 50 years as the density of population increased from 117 persons/ sq km in 1951 to 382 persons/sq km in 2011.
- Spatial variation of population densities in the country ranges from as low as 17 persons per sq km in Arunachal Pradesh to 11,297 persons in the National Capital Territory of Delhi.
- Among the northern Indian States, Bihar (1102), West Bengal (1029) and Uttar Pradesh (828) have higher densities.
- Kerala (859) and Tamil Nadu (555) have higher densities among the peninsular Indian states.
- States like Assam, Gujarat, Andhra Pradesh, Haryana, Jharkhand, Odisha have moderate densities.
- The hill states of the Himalayan region and Northeastern states of India (excluding Assam) have relatively low densities while the UTs (excluding Andaman & Nicobar Islands) have very high densities of population.
- Physiological density = total population / net cultivated area.
- Agricultural density = total agricultural population / net cultivable area.
- The agricultural population includes cultivators and agricultural laborers and their family members.
3. Population Doubling Time
- Population doubling time is the time taken by any population to double itself at its current annual growth rate.
- The growth rate of population in India over the last century has been caused by the annual birth rate and death rate and rate of migration and thereby show different trends.
- There are four distinct phases of growth identified within this period.
Phase I
- The period from 1901-1921 is referred to as a period of stagnant or stationary phase since in this period population growth rate was very low, even recording a negative growth rate during 1911-1921.
- Both the birth rate and death rate were high keeping the rate of increase low.
- Poor health and medical services, illiteracy of people at large, and inefficient distribution system of food and other basic necessities were largely responsible for high birth and death rates in this period.
Phase II
- The decades 1921 -1951 are referred to as the period of steady population growth.
- An overall improvement in health and sanitation throughout the country brought down the mortality rate.
- At the same time, better transport and communication system improved distribution system.
- The crude birth rate remained high in this period leading to a higher growth rate than the previous phase.
- This is impressive in the backdrop of the Great Economic Depression, the 1920s, and World War II.
Phase III
- The decades 1951-1981 are referred to as the period of population explosion in India, which was caused by a rapid fall in the mortality rate but a high fertility rate of population in the country.
- The average annual growth rate was as high as 2.2 percent.
- Developmental activities led to the improvement of the living condition of people at large.
- Consequently, there was a high natural increase and a higher growth rate.
- Besides, increased international migration bringing in Tibetans, Bangladeshis, Nepalis, and even people from Pakistan contributed to the high growth rate.
Phase IV
- Post-1981, the growth rate though remained high, has started slowing down gradually.
- A downward trend of crude birth rate is held responsible for such population growth.
- This was, in turn, affected by an increase in the mean age at marriage, improved quality of life particularly education of females in the country.
- The growth rate of population is, however, still high in the country, and it has been projected by World Development Report that the population of India will touch 1,350 million by 2025.
4. Regional Variation in Population Growth
- The States like Kerala, Karnataka, Tamil Nadu, Andhra Pradesh, Odisha, Puducherry, and Goa show a low rate of growth not exceeding 20 percent over the decade.
- Kerala registered the lowest growth rate (9.4) in the country.
- Gujarat, Maharashtra, Rajasthan, Punjab, Haryana, Uttar Pradesh, Uttarakhand, Madhya Pradesh, Sikkim, Assam, West Bengal, Bihar, Chhattisgarh, and Jharkhand have relatively high growth rate (20-25 percent).
- The percentage decadal growth rates of the six most populous States, namely, Uttar Pradesh, Maharashtra, Bihar, West Bengal, Andhra Pradesh, and Madhya Pradesh have all fallen during 2001-2011.
- Tamil Nadu (3.9 percentage points) and Puducherry (7.1 percentage points) have registered some increase during 2001-2011 over the previous decade.
- An important aspect of population growth in India is the growth of its adolescents.
- At present, the share of adolescents i.e., up to the age group of 10-19 years is about 20.9 percent (2011), among which male adolescents constitute 52.7 percent and female adolescents constitute 47.3 percent.
- The National Youth Policy has been designed to look into the overall development of our large youth and adolescent population.
- The National Youth Policy (NYP–2014) launched in February 2014 proposes a holistic ‘vision’ “To empower the youth of the country to achieve their full potential, and through them enable India to find its rightful place in the community of nations”.
- The NYP–2014 has defined ‘youth’ as persons in the age group of 15–29 years.
- The Government of India also formulated the National Policy for Skill Development and Entrepreneurship in 2015 to provide an umbrella framework to all skilling activities being carried out within the country. Population Composition Rural-Urban Composition
- In India, 68.8 percent of the total population lives in 640,867 villages (2011).
- States like Bihar and Sikkim have a very high percentage of the rural population.
- The states of Goa and Maharashtra have only little over half of their total population residing in villages.
- The Union Territories, on the other hand, have a smaller proportion of the rural population, except Dadra and Nagar Haveli (53.38 percent).
- The size of villages also varies considerably.
- It is less than 200 persons in the hill states of north-eastern India, Western Rajasthan, and Rann of Kuchchh, and as high as 17 thousand persons in the states of Kerala and in parts of Maharashtra.
- The growth rate of the urban population has accelerated due to enhanced economic development and improvement in health and hygienic conditions.
- The distribution of urban population too has a wide variation throughout the country.
- In the agriculturally stagnant parts of the middle and lower Ganga Plains, Telangana, non-irrigated Western Rajasthan, remote hilly, tribal areas of the northeast, along with the flood-prone areas of Peninsular India and along the eastern part of Madhya Pradesh, the degree of urbanization has remained low.
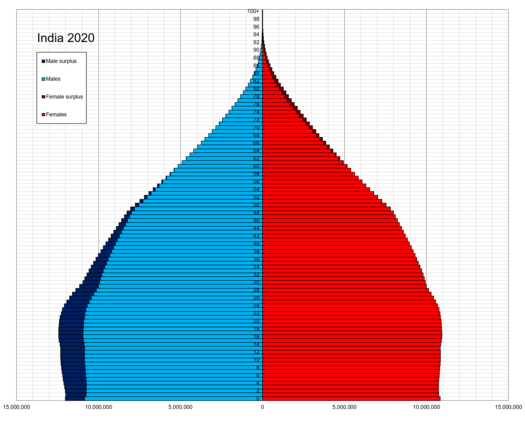 India Population Pyramid- 2020
5. Linguistic Composition
- In the context of modern India, there are about 22 scheduled languages and a number of non-scheduled languages.
- Among the scheduled languages, the speakers of Hindi have the highest percentage.
- The smallest language groups are Sanskrit, Bodo, and Manipuri speakers (2011).
6. Linguistic Classification
- The speakers of major Indian languages belong to four language families, which have their sub-families and branches or groups.
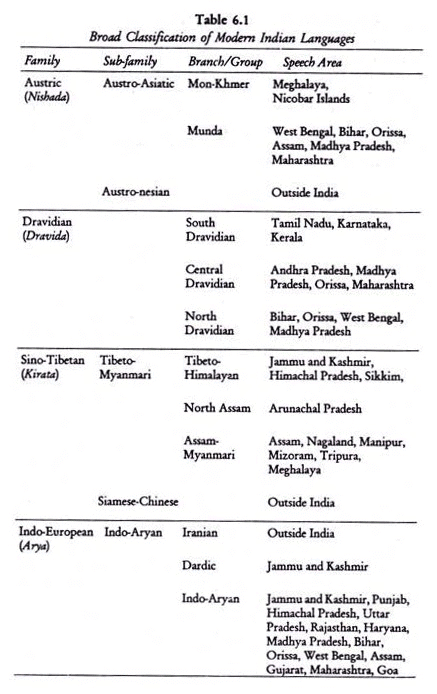
7. Religious Composition
- Hindus are distributed as a major group in many states (ranging from 70- 90 per cent and above) except the districts of states along Indo-Bangladesh border, Indo-Pak border, Jammu & Kashmir, Hill States of North-East and in scattered areas of Deccan Plateau and Ganga Plain.
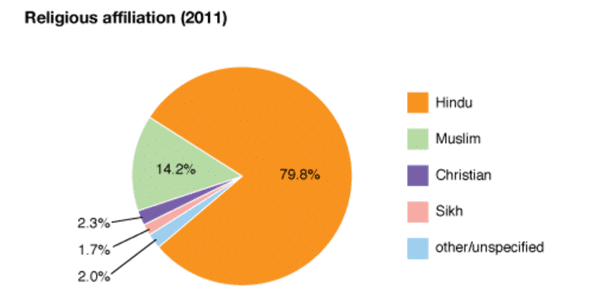
- Muslims, the largest religious minority, are concentrated in Jammu & Kashmir, certain districts of West Bengal and Kerala, many districts of Uttar Pradesh, in and around Delhi and in Lakshadweep.
- They form a majority in Kashmir valley and Lakshadweep.
- The Christian population is distributed mostly in rural areas of the country.
- The main concentration is observed along the Western coast around Goa, Kerala and also in the hill states of Meghalaya, Mizoram, Nagaland, Chotanagpur area and Hills of Manipur.
- Sikhs are concentrated in a relatively small area, particularly in the states of Punjab, Haryana and Delhi.
- Jains and Buddhists, the smallest religious groups in India have their concentration only in selected areas of the country.
- Jains have a major concentration in the urban areas of Rajasthan, Gujarat and Maharashtra, while the Buddhists are concentrated mostly in Maharashtra.
- The other areas of the Buddhist majority are Sikkim, Arunachal Pradesh, Ladakh in Jammu & Kashmir, Tripura, and Lahul and Spiti in Himachal Pradesh.
- The other religions of India include Zoroastrians, tribal and other indigenous faiths and beliefs.
- These groups are concentrated in small pockets scattered throughout the country. Composition of Working Population
- The population of India according to their economic status is divided into three groups, namely; main workers, marginal workers, and non-workers.
- Main Worker is a person who works for at least 183 days (or six months) in a year.
- Marginal Worker is a person who works for less than 183 days (or six months) in a year.
- It is observed that in India, the proportion of workers (both main and marginal) is only 39.8 percent (2011) leaving a vast majority of about 60 percent as non-workers.
- The states with larger percentages of workers are Himachal Pradesh, Sikkim, Chhattisgarh, Andhra Pradesh, Karnataka, Arunachal Pradesh, Nagaland, Manipur, and Meghalaya.
- Among the Union Territories, Dadra and Nagar Haveli and Daman and Diu have higher participation rates.
- It is understood that, in the context of a country like India, the work participation rate tends to be higher in the areas of lower levels of economic development since the number of manual workers is needed to perform the subsistence or near subsistence economic activities.
- The occupational composition of India’s population shows a large proportion of primary sector workers compared to secondary and tertiary sectors.
|
175 videos|624 docs|192 tests
|
FAQs on Human Geography: Population - Geography for UPSC CSE
| 1. What are the basic terms related to population and growth? |  |
| 2. What factors influence the distribution of population? |  |
| 3. What are the components of population change? |  |
| 4. What is an age-sex pyramid? |  |
| 5. What is an ageing population? |  |


