Stress Strain Diagrams


Introduction
Stress-strain diagrams and their interrelationships are fundamental for the selection and use of engineering materials. Using a material in manufacture without knowing its stress-strain behaviour is inadvisable. The stress-strain curve is obtained by plotting stress versus strain from the data of a tensile test of a specimen. Each material has a characteristic curve that reveals several mechanical properties such as the modulus of elasticity (E), yield behaviour, ductility, toughness and strength. During a tensile test, changes in length are recorded by strain-measuring devices while load is recorded by the testing machine; stress is obtained from load and cross-sectional area, and strain from change in length and original length.
Stress-Strain Diagram for a Ductile Material (Mild Steel)
The initial portion of the tensile test shows elastic behaviour: strain is proportional to applied stress and the specimen returns to its original dimensions on removal of load. The region in which Hooke's law (σ ∝ ε) is valid is up to the proportionality limit. Beyond the elastic limit the material deforms plastically and a permanent extension remains after unloading. Plastic strain increases more rapidly compared with stress until the yield point is reached, where the material may show a sudden increase in strain at nearly constant stress. Further loading produces work hardening (strain hardening) which increases the stress required for further plastic deformation until the ultimate tensile stress (maximum engineering stress) is reached.
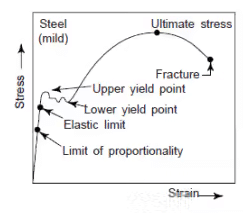
- Proportionality limit: the stress up to which stress and strain are strictly proportional.
- Elastic limit: the maximum stress at which the material will return to its original dimensions on unloading.
- Yield point / Yield strength: the stress at which appreciable plastic deformation begins; in mild steel a distinct yield point is often observed.
- Normal (engineering) stress: the applied load divided by the original cross-sectional area.
- Ultimate tensile stress (UTS): the maximum engineering stress equal to the maximum load divided by the original area.
- Necking: after UTS, localised reduction in cross-sectional area develops and plastic deformation becomes concentrated in the neck. Engineering stress falls after UTS though true stress (based on instantaneous area) may continue to rise.
- Creep: time-dependent, slow increase in strain under a constant applied stress; most noticeable at elevated temperatures.
- Volume constancy: during plastic elongation the volume of the specimen is approximately conserved so an increase in length corresponds to a reduction in cross-sectional area.
Stress-Strain Diagram for a Brittle Material
Brittle materials do not show significant plastic deformation before fracture. In such materials the proportionality limit, elastic limit, yield point and fracture point may appear very close together and a well-defined yield point is often absent. The elastic region is typically linear and fracture follows with little or no visible plastic deformation.
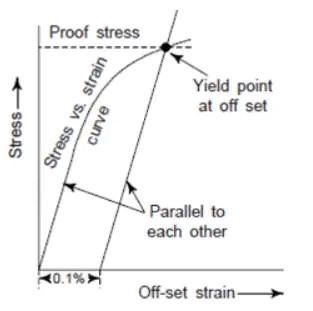
- Offset yield method: where a clear yield point is absent, the yield strength is determined by drawing a line parallel to the elastic portion of the curve but offset by a specified strain value (commonly 0.1% or 0.2%). The intersection of this offset line with the stress-strain curve gives the yield strength at the chosen offset (for example, yield strength at 0.2% offset).
Note:
- A steeper slope in the initial linear portion (greater angle of inclination) indicates a larger modulus of elasticity and therefore a stiffer (more elastic) material.
- Materials showing a higher yield point generally indicate greater resistance to permanent deformation and often correlate with greater hardness.
- A higher value of the maximum stress (UTS) indicates a stronger material in tension.
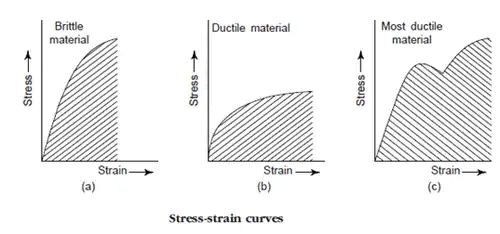
- The distance between the ordinate at fracture and the ordinate at maximum load on the stress-strain diagram is an indicator of ductility: a small distance corresponds to a brittle material and a larger distance to a ductile material. Toughness corresponds to the area under the stress-strain curve up to fracture.
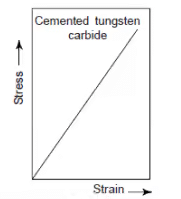
Stress-Strain diagram for Cemented Tungsten Carbide:
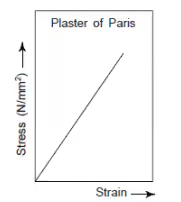
Stress-Strain diagram for Plaster of Paris:
Stress-Strain diagram for Soft Rubber:
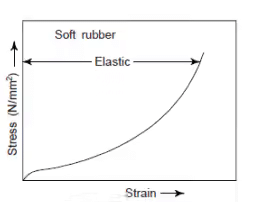
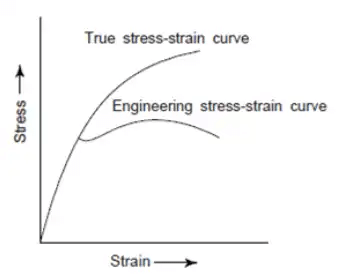
Engineering and True Stress-Strain Diagrams
When stress is calculated using the original cross-sectional area the result is called engineering (nominal) stress. When stress is calculated using the instantaneous cross-sectional area at each load increment it is called true stress. Similarly, strain calculated using the original length is called engineering strain, while strain using instantaneous length changes leads to true strain. Engineering curves are convenient for design and comparison; true curves are required to describe actual material behaviour, especially beyond significant plastic deformation and necking.
Some Important Mechanical Properties of Materials
Brittleness
- Defined as the property of a material that causes fracture without appreciable prior deformation.
- It is the opposite of ductility.
- Examples: glass, concrete and cast iron.
- Materials with less than about 5% elongation in tension are commonly classified as brittle.
Toughness
- Defined as the ability of a material to absorb energy up to fracture; numerically it is the area under the stress-strain curve up to the point of fracture.
- A tough material can undergo significant twisting, bending or stretching before failure.
- Toughness usually decreases with increasing temperature sensitivity for some materials; at elevated temperatures some materials become less tough.
- Toughness is a critical selection criterion for components that must withstand shock, impact, or vibration.
Stiffness
- Stiffness is the resistance of a material to elastic deformation under load.
- Stiffness is quantified by the modulus of elasticity (E); a larger E means the material deforms less elastically under the same stress.
- Stiffness and flexibility are opposite characteristics.
Resilience
- Resilience is the capacity of a material to store elastic energy and release it when the load is removed.
- The measure of resilience is the energy absorbed per unit volume when the material is stressed up to its elastic limit (area under the elastic portion of the stress-strain curve).
- Resilience is an important property for materials used in springs and shock-absorbing components.
Endurance (Fatigue) Behaviour
- Endurance refers to the ability of a material to withstand fluctuating or cyclic stresses.
- Endurance limit (fatigue limit) is the maximum stress amplitude below which the material can withstand an effectively infinite number of cycles without failure (not all materials exhibit a clear endurance limit).
- This property is critical for components in reciprocating machines, shafts, gears and other parts subjected to vibration or repeated loading.
Anelastic Behaviour
- Anelastic behaviour is time-dependent, recoverable deformation: deformation continues while load is applied and recovery on unloading is gradual.
- It is due to internal relaxation processes within the material and results in delayed elastic recovery after unloading.
Viscoelastic Behaviour
- Viscoelastic materials show both elastic (recoverable) and viscous (permanent, time-dependent) deformations under load.
- This behaviour is typical of non-crystalline organic polymers (rubbers, plastics) and biological tissues.
- Permanent time-dependent deformation under sustained load in such materials is analogous to creep in crystalline solids.
Summary
Stress-strain diagrams are essential tools for understanding mechanical behaviour: they identify elastic and plastic ranges, yield and ultimate strengths, toughness, ductility and stiffness. Distinguishing engineering from true stress-strain behaviour is important when interpreting tests beyond uniform plastic deformation and during necking. Knowledge of these diagrams and derived properties is fundamental to material selection and safe, economical engineering design.
FAQs on Stress Strain Diagrams
| 1. What is a stress-strain diagram in mechanical engineering? |  |
| 2. How is a stress-strain diagram obtained? | |
| 3. What does the elastic region of a stress-strain diagram represent? | |
| 4. What is yield strength in a stress-strain diagram? | |
| 5. How can a stress-strain diagram be used in material selection? | |


