Phase Diagrams | Engineering Materials - Mechanical Engineering PDF Download

Phase
- A phase is a physically distinct, chemically homogeneous, and mechanically separable region in a system in equilibrium.
- If more than one phase is present in a given system, each phase will have its own distinct properties and a boundary separating it.
Gibb’s phase rule
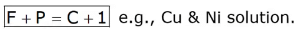
F + P = C + 2
where, F = No. of degrees of freedom.
P: No of phases present.
C: No of components
Note: The degree of freedom is zero at the triple point.
Phase Equilibrium
- The consistency in the physical and chemical properties of the phase relative to time is the indication of the equilibrium.
- It does not give the idea of time gap needed to attain the equilibrium conditions.
Phase Diagram (Equilibrium or Constitutional Diagram)
- It is a plot on temperature-composition scale showing the stability of different phases.
- It shows the relationship between temperature, the compositions and the quantities of phases present in an alloy system under equilibrium conditions.
- On the temperature change various microstructures develop and involve transition from one phase to another phase, which can be predicted by the phase diagrams.
Type of Phase Diagrams
- Unary phase diagram (single component)
Such phase diagram is used for carbon and pure metal and has limited practical application. These are plotted on temperature and Pressure axis.
Example: Water, graphite, metallic carbon, diamond. - Binary phase diagram (two components)
Type I: Binary Amorphous Systems
Here, the materials are completely soluble in liquid as well as solid state.
(i) The most metals are completely soluble in solid slate thus solid phase is a type substitutional solid.
(ii) Here, the metals have similar crystal structure and the difference in their atomic radii is less than the 8%.
Example: Cu -Ni phase diagram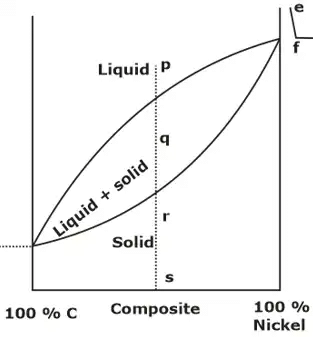 (a) The locus of the points where solidification starts is known as liquidus line (upper curved line in diagram), the locus of the points where there is end of solidification is known as the solidus line (Lower curved line in the diagram).
(b) Above the liquids line, Area is single phase region and alloy forms homogeneous liquid solution. Similarly, region below solidus line is homogeneous in nature and alloys is in solid state.
(c) A two-phase region i.e. mushy zone having both liquid and solid, exists between the solidus and liquidus line.
Rules to find the actual composition and relative amounts of phases present:
Rule 1: Chemical composition of phases
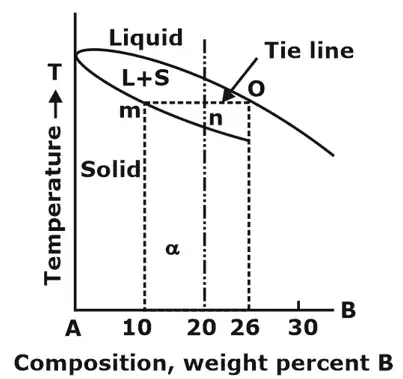
- In equilibrium condition, a tie line (a horizontal temperature line) between the the boundaries of the field is drawn to determine the actual chemical composition of the phases of an alloy and a vertical line corresponding to a specified composition is drawn as shown in figure. The intersection points on boundaries are extended to base line, and one can read composition directly.
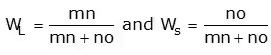
Rule 2: Relative amount of each phase (Using Lever Rule)
- In equilibrium condition, a tie line (a horizontal temperature line) between the the boundaries of the field is drawn to determine the actual chemical composition of the phases of an alloy and a vertical line corresponding to a specified composition is drawn as shown in figure.
- The vertical line will intersect the horizontal line and divide it into two parts. The amount of phase present is inversely proportional to the lengths of these lines. This rule is called as Lever Rule.
Note: For phase diagram only one parameter is changed thus Gibb’s rule reduced to:
TYPE-II: Materials having completely solubility in liquid state but partial solubility in solid state (eutectic phase diagram):
Partial solubility means that one component can form a solid solution with other only up to a maximum concentration.
Binary Eutectic system consists of three phases as follows:
- α
- β (Solid solutions)
- Liquid phase (L)
Here a eutectic point is defined, where degree of freedoms are zero
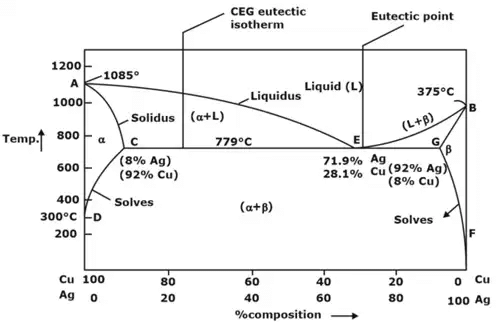
- α phase: It is rich in copper and Ag is present as solute and has FCC structure.
- β phase: It is rich in Ag and Cu is present as solute and again has FCC structure.
- (α + β) phase: constitutes of pure copper (Cu) and pure silver (Ag).
Below line CEG (779°C), there is only partial solubility of Ag in Cu (a phase) and Cu in Ag (phase). Maximum solubility of Ag in Cu occurs at 779°C and is 8%.
Solvus line demarcates between α and (α + β) phases and β and (α + β) phases.
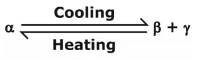
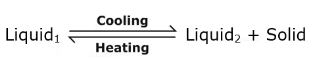
- Eutectoid reaction: Here a solid phase (α) directly transforms to two others solid phase (β) and (γ). Eutectoid means eutectic like. It is also an invariant reaction. It is denoted by point E.
- Peritectic reaction: It involves three phases at equilibrium and upon cooling a solid and a liquid combine isothermally to form a new solid phase(β).
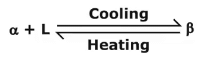
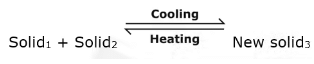
The new solid formed is usually an intermediate phase but in some case, it is terminal solid solution. Peritectic reaction occurs in alloys having large difference in melting point. - Peritectoid reaction: It involves reaction between two solid and final products will be solid.
- Monotectic reaction:
Note: Eutectic temperature is lowest melting point as compared to that for all other composition.
Iron-Carbon Phase Diagram
- The Fe-Fe3C is defined by five individual phases and four invariant reactions. Five phases are:
(i) α-ferrite: C and iron (Fe) solid solution in alpha iron (BCC).
(ii) γ-austenite: C and iron (Fe) solid solution in Austenite (FCC iron).
(iii) δ-ferrite: C and iron (Fe) solid solution in delta iron
(iv) Fe3C (iron carbide) or cementite: an inter-metallic compound and liquid Fe-C solution. - Four invariant reactions are eutectic, Eutectoid, monotectic and peritectic.
- Pure iron upon heating exhibits two allotropic changes as shown below:
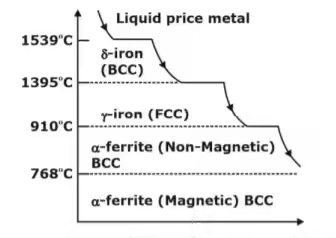
- Carbon present in solid iron as interstitial impurity, and forms solid solution with ferrites/austenite as depicted by three single fields represented by α, γ and δ. Carbon dissolves least in α -ferrite in which maximum amount of carbon soluble is 0.02% at 723°C.
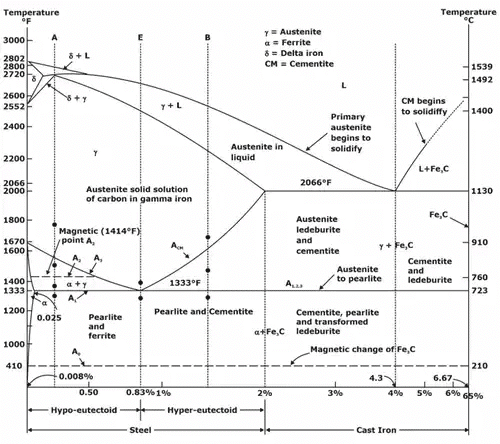
Fe-C system constitutes four invariant reactions:
(a) Peritectic reaction: at 1495°C and 0.16%C.
δ-ferrite + L ↔ γ-iron (austenite)
(b) Monotectic reaction: 1495°C and 0.51%C.
L ↔ L+ γ-iron (austenite)
(c) Eutectic reaction: at 1147°C and 4.3%C.
L ↔ γ-iron + Fe3C (cementite)
The mixture of γ-iron + Fe3C (cementite) is called the ledburite.
(d) Eutectoid reaction: at 723°C and 0.8%C.
γ-iron L ↔ α-ferrite + Fe3C (cementite) [pearlite]
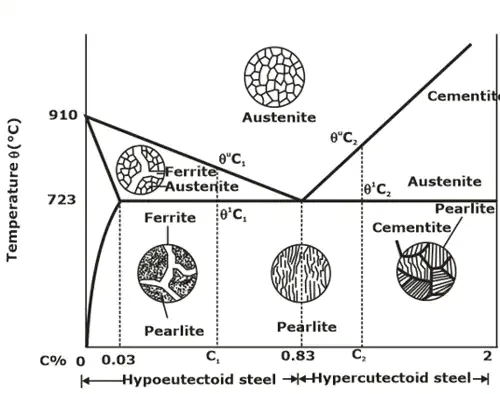 Microstructures of various phase of steel.
Time-temperature-transformation (TTT) diagrams
- The information on the change of phase with the cooling rate can be conveniently displayed with the help of a time-temperature-transformation diagram (commonly known as the TTT diagram). In such a diagram, the temperature is plotted along the vertical axis (using a linear scale), whereas the abscissa represents the time on a logarithmic scale.
- Isothermal transformation diagram, also called as TTT diagram, measures the rate of transformation at a constant temperature i.e. it shows time relationships for the Phases during isothermal transformation. Information regarding the time to start the transformation and the time required to complete the transformation can be obtained from set of TTT diagrams.
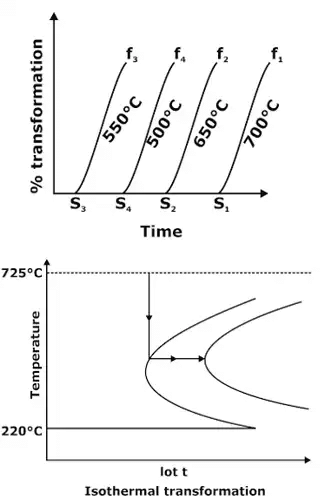 Temperature-Time diagram
 - This temperature-time curve is also termed as S-curve or Ben-curve. The outer curve represents the starting of transformation and the inner curve represents the completion of transformation. At about 550°C, the transformation starts after a minimum lapse of time and the starting point of transformation at 550°C is called nose. A continuous cooling rate which touches the nose of temperature-time diagram is called critical cooling rate.
- At transformation temperatures below 550°C, austenite results in different product known as bainite. This process is called Austempering. Bainite consists of α-ferrite and cementite phases.
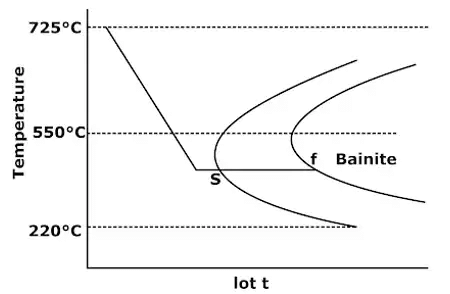 Bainite formation
- Martempering is performed in two steps, first the steel quenched in water to a temperature 300-400° C and then quickly transferred to a less temperature medium like oil where are held until it is completely cooled.
- As this is done in step so it is called as stepped quenching, after heating steel to hardening temperature. It is quenched in a medium to a hardening temperature slightly above (240°C). The Holding time must be enough so that part reaches the temperature of ceding medium.
- Longer holding times as compared to martempering in hot bath. Austenite transforms to Bainite. Here molten salts & alkalies are used as quenching media. Temperature is maintain between 150°C-450°C. Here, sample has quenched below the nose of TTT diagram but above the martensite start line then it holds for longer period.
|
15 videos|35 docs|13 tests
|
FAQs on Phase Diagrams - Engineering Materials - Mechanical Engineering
| 1. What is a phase diagram and why is it important in mechanical engineering? |  |
| 2. How can phase diagrams help in material selection for mechanical engineering applications? | |
| 3. What are the key features to look for in a phase diagram for mechanical engineering purposes? | |
| 4. How can phase diagrams be used to optimize heat treatment processes in mechanical engineering? | |
| 5. Are phase diagrams applicable only to pure substances or can they also be used for alloys and mixtures? | |


MCQs
,ppt
,Previous Year Questions with Solutions
,study material
,Phase Diagrams | Engineering Materials - Mechanical Engineering
,mock tests for examination
,Summary
,Phase Diagrams | Engineering Materials - Mechanical Engineering
,shortcuts and tricks
,practice quizzes
,Free
,Objective type Questions
,Important questions
,Sample Paper
,Viva Questions
,Extra Questions
,video lectures
,past year papers
,Phase Diagrams | Engineering Materials - Mechanical Engineering
,Semester Notes
,Exam
;


Phase Diagrams Free PDF Download
Importance of Phase Diagrams
Phase Diagrams Notes
Phase Diagrams Mechanical Engineering Questions
Study Phase Diagrams on the App
|
© EduRev
|
Education Revolution
|


|


