Measures of Central Tendency | General Aptitude for GATE - Mechanical Engineering PDF Download

Central Tendency
Measures of central tendency describe a set of data by identifying the central position in the data set as a single representative value.We come across new data every day. We find them in newspapers, articles, in our bank statements, mobile and electricity bills. Now the question arises whether we can figure out some important features of the data by considering only certain representatives of the data.
This is possible by using measures of central tendency. In the following sections, we will look at the different measures of central tendency. We will also learn how to calculate them and under what situations they are most appropriate to be used. We can think of it as a tendency of data to cluster around a middle value. In statistics, the three most common measures of central tendencies are mean, median, and mode. Let’s begin by understanding the meaning of mean, median, and mode along with an example to support our understanding.
What Are Measures of Central Tendency?
Measures of central tendency are the values that describe a data set by identifying the central position of the data. There are 3 main measures of central tendency - Mean, Median and Mode.
Let us study about the measures of central tendency, their formulas, usage and types in detail below:
Mean
The mean (often called the average) is most likely the measure of central tendency that you are most familiar with. It is also known as average. Mean is simply the sum of all the components in a group or collection, divided by the number of components.
It is denoted by x̄, pronounced “x bar”.
Mean = Sum of the terms/ Number of terms
Example:
To understand the definition, let us look at the weights of 8 boys in kilograms: 45, 39, 53, 45, 43, 48, 50, 45. So, in the above example, there are 8 boys.
Therefore, the average of the group:
Average = Sum of the weights/Number of boys
= (45 + 39 + 53 + 45 + 43 + 48 + 50 + 45)/8
= 368/8
= 46
Thus, the average weight of the group is 46 kilograms.
Let us now see how to calculate the mean for different types of data along with an example.
Case 1:
So, if we have n values in a data set and they have values x1,x2, …,xn, the sample mean, usually denoted by x― (pronounced "x bar"), is:
This formula is usually written in a slightly different manner using the Greek capital letter, ∑, pronounced "sigma", which means "sum of...":
You may have noticed that the above formula refers to the sample mean. So, why have we called it a sample mean? This is because, in statistics, samples and populations have very different meanings and these differences are very important, even if, in the case of the mean, they are calculated in the same way. To acknowledge that we are calculating the population mean and not the sample mean, we use the Greek lower case letter "mu", denoted as μ:
μ = ∑x/n
Example: If the heights of 5 people are 142 cm, 150 cm, 149 cm, 156 cm, and 153 cm.
Find the mean height.
Mean height
x̅ = 142+150+149+156+153/5
= 750/5
=150
Case 2:
Let there be n number of items in a list x1, x2, x3, … , xn. Let the frequency of each item be f1, f2, f3, … , fn respectively. The mean can be calculated using the formula given below.
x̅ = f1x1 + f2x2 + f3x3 +.....+ fnxn / f1 + f2 + f3 + .....+ fn
OR
x̅ = ∑fixi/n
Consider the following example.
Example:
Find the mean of the following distribution:
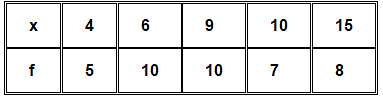 Solution:
Calculation table for arithmetic mean:
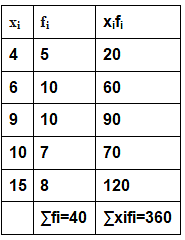
∴ Mean=¯x= ∑xifi/∑fi = 360/40 = 9
∴ Mean = 9
Case 3:
When the items in a list are written in the form of a range, for example, 10-20, we need to first calculate the class mark.
Class Mark = Upper Limit + Lower Limit / 2
Then, the mean can be calculated using the formula given below, where xi will be the classmark for each item.
Example:
Here is an example where the data is in the form of class intervals. The following table indicates the data on the number of patients visiting a hospital in a month. Find the average number of patients visiting the hospital in a day.
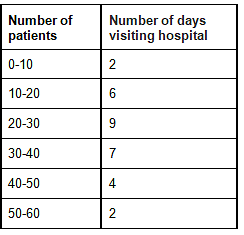
Solution
In this case, we find the classmark (also called as mid-point of a class) for each class.
Classmark = lower limit + upper limit/2
Let x1, x2, x3 ……xn be the class marks of the respective classes.
Hence, we get the following table

Mean = x̅ = ∑fixi/∑fi
= 860/30
= 28.67
When not to use the mean
The mean has one main disadvantage: it is particularly sensitive to outliers. These are values that are unusually larger or smaller compared to the rest of the data. For example, consider the salary of staff at a factory below:
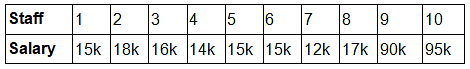
The mean salary for these ten staff is $30.7k. However, the raw data suggests that this mean value does not accurately reflect the typical salary of a worker, because most workers have salaries in the $12k to 18k range. Thus the mean is being skewed by the two large salaries. Therefore, in this situation, we would like to have a better measure of central tendency. As we will find out later, taking the median would be a better measure of central tendency in this situation.
Median
The value of the middle-most observation that is obtained after arranging the data in ascending order is called the median of the data. The advantage of using the median as a central tendency is that it is less affected by outliers and skewed data. To calculate the median, let us suppose we have the data below:
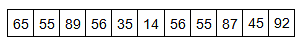
Firstly, we need to rearrange that data into ascending order:
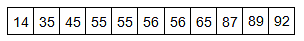
The median mark will be the middle mark - here, 56 (highlighted in bold). It is the middle mark because it lies in the exact center as there are 5 scores before it and 5 scores after it. This works very well when we have an odd number of scores, but what when we have an even number of scores? What if you had 10 scores? Well, then we simply take the middle two scores and find their average. Let us look at the example below:
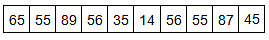
Rearranging that data into ascending order:
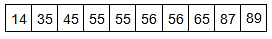
We now take the 5th and 6th score in our data set and average them. We get a median of 55.5.
Let us now learn how to calculate the median for different types of data along with a supporting example.
Case 1: Ungrouped Data
Step 1: Arrange the data in ascending or descending order.
Step 2: Let the total number of observations be n.
To find the median, we need to consider if n is even or odd.
If n is odd, then use the formula:
Median = [(n+1)/2]th observation
Example:
Let's consider the data: 56, 67, 54, 34, 78, 43, 23. What is the median?
For finding the mean, arrange the data in ascending order: 23, 34, 43, 54, 56, 67, 78.
Here, n (no. of observations) = 7
So,
Median = (7 + 1)/2 = 4th observation
Median = 54
Case 2: Grouped Data
If n is even, then use the formula:
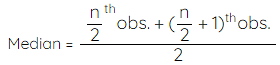
Step 1: Find the median class.
When the data is continuous and in the form of a frequency distribution, the median is found as shown below:
Let n = total number of observations i.e. ∑fi
Note: Median Class is the class where n/2 lies.
Step 2: Use the following formula to find the median.
Median = l + [(n/2-c)/f] × h
c = cumulative frequency of the class preceding the median class where,
l = lower limit of the median class
f = frequency of the median class
h = class size
Example:
Find the mode of the given data:

Solution
The highest frequency = 12, so the modal class is 40-60.
And,
- l = lower limit of modal class = 40
- fm = frequency of modal class =12
- f1= frequency of class preceding modal class = 10
- f2 = frequency of class succeeding modal class = 6
- h = class width = 20
Using the mode formula,
Mode = l + [(fm-f1)(2fm-f1-f2)] × h
= 40+[(12-10)(2 × 12 - 10-6)] × 20
= 40+[(2/8) ] × 20
= 45
Mode = 45
Mode
The value which appears most often in the given data i.e. the observation with the highest frequency is called the mode of data.
Case 1: Ungrouped Data
For ungrouped data, we just need to identify the observation which occurs maximum times.
Mode = Observation with maximum frequency
For example in the data: 6, 8, 9, 3, 4, 6, 7, 6, 3 the value 6 appears the most number of times. Thus, mode = 6. An easy way to remember mode is: Most Often Data Entered. Depending upon the number of modes the data has, it can be called unimodal, bimodal, trimodal, or multimodal. The example discussed above has only 1 mode, so it is unimodal. Note: A data may have no mode, 1 mode, or more than 1 mode.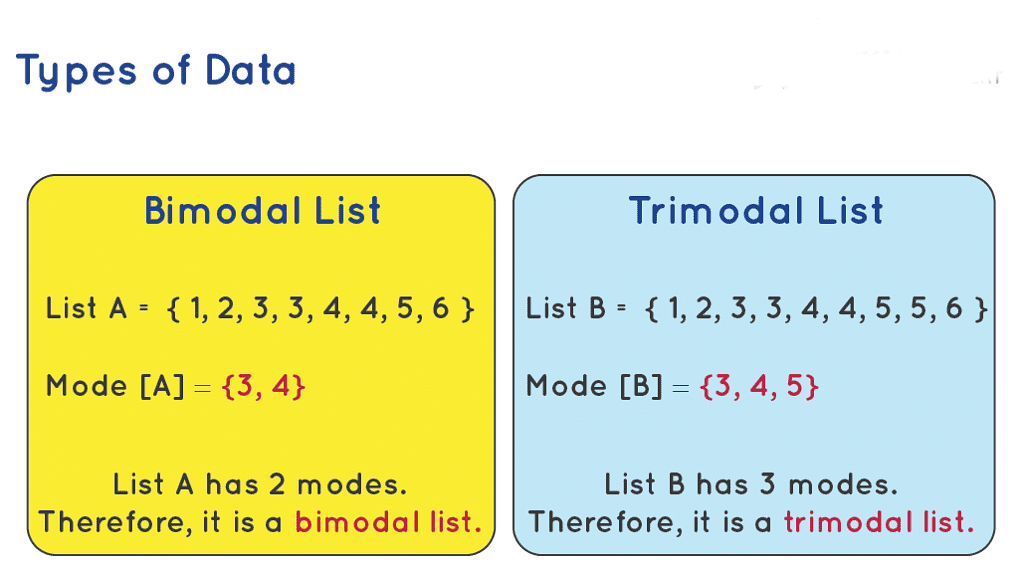
Case 2: Grouped Data
When the data is continuous, the mode can be found using the following steps:
Step 1: Find modal class i.e. the class with maximum frequency.
Step 2: Find mode using the following formula:
Mode = l + [(fm-f1)/ (2fm-f1-f2)] × h
where,
- l = lower limit of modal class,
- fm = frequency of modal class,
- f1= frequency of class preceding modal class,
- f2 = frequency of class succeeding modal class,
- h = class width
Consider the following example to understand the formula.
Example 1
Find the mode of the given data:
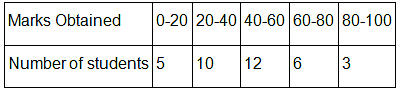
Solution
The highest frequency = 12, so the modal class is 40-60.
And,
- l = lower limit of modal class = 40
- fm = frequency of modal class =12
- f1 = frequency of class preceding modal class = 10
- f2 = frequency of class succeeding modal class = 6
- h= class width = 20
Using the mode formula,
Mode = l + [(fm-f1)/(2fm-f1-f2)] × h
= 40+[(12-10)/(2 × 12 - 10-6) ] × 20
= 40+[2/8] × 20 = 45
Mode = 45
Empirical Relation Between Measures of Central Tendency
The three measures of central tendency i.e. mean, median, and mode are closely connected by the following relations (called an empirical relationship).
For instance, if we are asked to calculate the mean, median, and mode of continuous grouped data, then we can calculate mean and median using the formulae as discussed in the previous sections and then find mode using the empirical relation.
Example: We have data with mode 65 and a median of 61.6, then, we can find the mean using the above relation.
2Mean + Mode = 3Median
2Mean = 3Median - Mode
2Mean = 3 × 61.6 - 65
2Mean = 119.8
Mean = 119.8/2 = 59.9
Difference between Mean and Average
The term average is frequently used in everyday life to denote a value that is typical for a group of quantities. Average rainfall in a month or the average age of employees of an organization are typical examples.
We might read an article stating "People spend an average of 2 hours every day on social media." We understand from the use of the term average that not everyone is spending 2 hours a day on social media but some spend more time and some less. However, we can understand from the term average that 2 hours is a good indicator of the amount of time spent on social media per day.
Most people use average and mean interchangeably even though they are not the same.
- Average is the value that indicates what is most likely to be expected.
- They help to summarise large data into a single value.
An average tends to lie centrally with the values of the observations arranged in ascending order of magnitude. So, we call an average measure of the central tendency of the data. Averages are of different types. What we refer to as mean i.e. the arithmetic mean is one of the averages. Mean is called the mathematical average whereas median and mode are positional averages.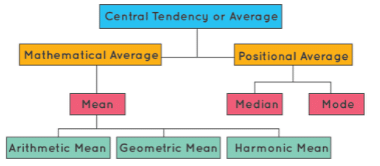 Measure of Central Tendancy
Difference between Mean and Median
The mean is known as the mathematical average whereas the median is known as the positional average. To understand the difference between the two, consider the following example.
A department of an organization has 5 employees which include a supervisor and four executives. The executives draw a salary of ₹10,000 per month while the supervisor gets ₹40,000.
Mean=(10000+10000+10000+10000+40000)/5 =80000/5 = 16000
Thus, the mean salary is $16,000.
To find the median, we consider the ascending order: 10000, 10000, 10000, 10000, 40000.
n=5, so (n+1)(2) = 3.
Thus, the median is the 3rd observation. Median = 10000. Thus, the median is $10,000 per month.
Now let us compare the two measures of central tendencies.
We can observe that the mean salary of $16,000 does not give even an estimated salary of any of the employees whereas the median salary represents the data more effectively. One of the weaknesses of mean is that it gets affected by extreme values. Look at the following graph to understand how extreme values affect mean and median:
So, the mean is to be used when we don't have extremes in the data. If we have extreme points, then the median gives a better estimation.
Here's a quick summary of the differences between the two.

|
194 videos|167 docs|152 tests
|
FAQs on Measures of Central Tendency - General Aptitude for GATE - Mechanical Engineering
| 1. What are measures of central tendency? |  |
| 2. What is the mode? | |
| 3. How are measures of central tendency empirically related? | |
| 4. What is the difference between mean and average? | |
| 5. What is the difference between mean and median? | |


Extra Questions
,Exam
,Previous Year Questions with Solutions
,Sample Paper
,Measures of Central Tendency | General Aptitude for GATE - Mechanical Engineering
,study material
,ppt
,Summary
,Important questions
,Measures of Central Tendency | General Aptitude for GATE - Mechanical Engineering
,video lectures
,Viva Questions
,Semester Notes
,practice quizzes
,MCQs
,Measures of Central Tendency | General Aptitude for GATE - Mechanical Engineering
,Free
,Objective type Questions
,past year papers
,shortcuts and tricks
,mock tests for examination
;


Measures of Central Tendency Free PDF Download
Importance of Measures of Central Tendency
Measures of Central Tendency Notes
Measures of Central Tendency Mechanical Engineering Questions
Study Measures of Central Tendency on the App
|
© EduRev
|
Education Revolution
|


|


