Graph of Linear Equations in Two Variables | Quantitative Aptitude for SSC CGL PDF Download

Linear equations are the first-order equations, i.e. the equations of degree 1. The equations which are used to define any straight line are linear, they are represented as,
x + k = 0;
These equations have a unique solution and can be represented on number lines very easily. Let’s look at linear equations in two variables, how they are represented, their graphs, and their solutions.
A linear equation in two variables is represented as,
ax + by = c,
Where a, b, and c are real numbers.
For example: 3x + 5y = 6 is an example of linear equation in two variables.
Solution of a Linear equation
Solutions of the linear equations are the points (x, y) that satisfy the given equation. Let’s see it with an example
x + y = 4
We will study the solutions to this equation.
x = 2 and y = 2 is a solution to this equation, so is x = 0 and y = 4 and (4, 0). We have got three points that satisfy this equation. But there are more than three points. For every value of x or for the value of y, we might get a value of the other variable. This shows that there infinitely many possible solutions to this equation.
So, a linear equation in two variables has infinitely many solutions. If we plot these solutions on a graph, how do they look? Let’s see the graphs of the linear equations.
The equations presented in the introduction, that is linear equations in one variable can also be represented in this form.
Let’s see it through an example
Question 1: Represent the following linear equation in one variable as a standard two-variable linear equation.
x + 6 = 0
Answer:
We need to bring it in the standard two variable linear equation form,
ax + by + c = 0
x + 6 = 0
Can be re-written as,
1.x + 0.y + 6 = 0.
Now we need to look at how to formulate these equations in real-life.
Question 2: Eric and Kyle go to a Halloween candy shop to buy some candies for “trick or treat” on Halloween. Eric buys 6 cola candies and Kyle buys 10 sour-sweet tooth candy. Shopkeeper asks for Rs 150 for all the candies. Formulate an equation for this situation to find out the cost of Cola and Sour-Sweet candy.
Answer:
Let’s say cost of Cola candy is “x” and cost of “Sour-Sweet” candy is “y”. Notice that problem has two variables, so we will have to formulate linear equation in two variables to represent this equation.
Cost of 6 cola candies = 6x,
Cost of 10 Sour-Sweet candies = 10y
Total Cost = Cost of 6 cola candies. + Cost of 10 Sour-sweet Candies.
150 = 6x + 10y
Thus, this is our required equation.
Graphs of the Linear Equation
Graphs for linear equations are drawn to obtain the straight lines, they are drawn with the help of coordinates of both the axis, getting such pairs on the graph and trying to create a pattern out of it gives us the straight lines. In the given linear equation, put different values of x in order to get different values of y, say, the pairs obtained are (x1, y1), (x2, y2), (x3, y3)…and so on. Now plot these points on the graph to get the straight line.
Plotting the points
Following are the steps to plot points on the graph:
Step 1: Pick different values of x
Step 2: Substitute those values in the given equation to solve for the values of y
Step 3: Plot the obtained respective pairs on the graph
Step 4: Obtaining such pairs (at least two or more than two) would help us identify how the straight line goes.
Finding X and Y Intercepts
Following are the steps to find x and y-intercepts:
Step 1: In order to find y-intercept, set x = 0, and solve for the value of y
Step 2: In order to find x-intercept, set y =0, and solve for the value of x
Step 3: Plot both the point on the graph and join them with a straight line.
Sample Problems
Question 1: Plot the graph of the equation,
x + y = 4
Solution:
Let’s list out the solutions of this equation.
x 0 1 2 3 4 5 …
y 4 3 2 1 0 -1 …
If we keep on listing these solutions, we will see that they form a straight line. Let’s plot that line of the graph.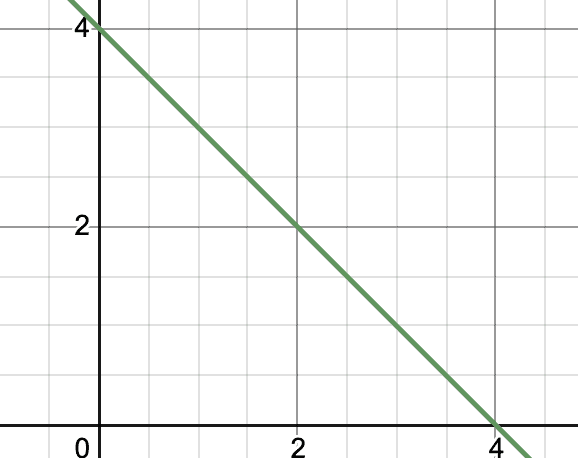
Question 2: Plot the graph of the equation,
2x – 4y = 12
Solution: Let’s list out the solutions to this equation,
x 0 1 2 3 4
y -3 -2.5 -2 -1.5 -1
We can join any of two these points to get the line.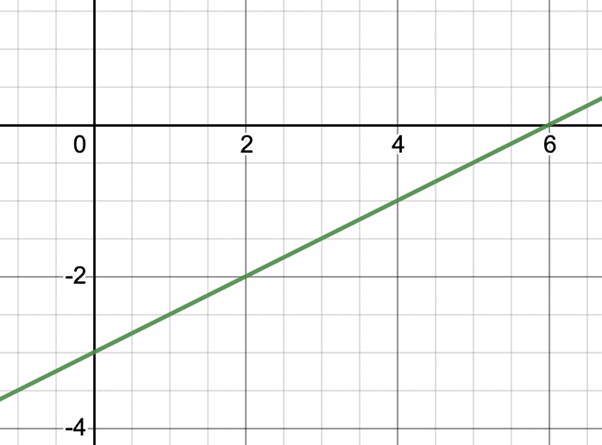
Let’s see some examples for linear equations which are parallel to x-axis and y-axis.
Question 3: Plot the graph of the following equation.
y = 6
Solution:
The equation when written in the form of linear equation in two variables.
0.x + 1.y = 6
We can see that it doesn’t matter what value of “x” we put in, it won’t affect the equation. So, to satisfy the equation value of “y” must be 6. Thus, our solution must have y = 6 and any other value of “x” will work.
So, the graph will look like this,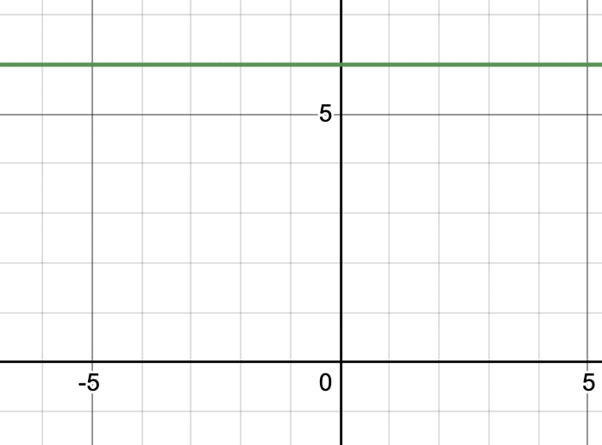
Notice that this graph is parallel to x -axis.
Question 4: Plot the graph of the following equation.
x = 7
Solution: Similar to above question, this equation can be represented as.
1.x + 0.y = 7
Here, value of “y” doesn’t matter and the value of “x” must be 7.
So, plotting this on the graph.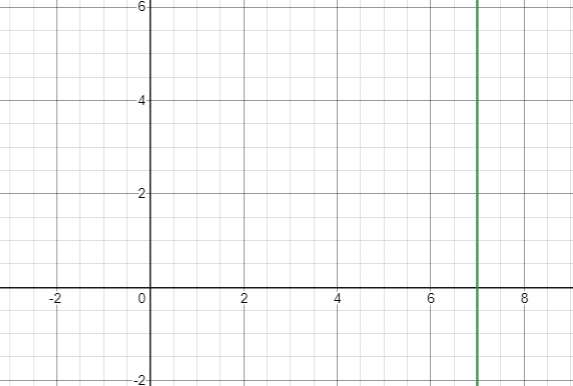
Thus, this is graph for x = 4.
Note: In general for any equation x = k, the graph will always be parallel to the y-axis. Similarly, the equation for y = k, the graph will always be parallel to the x-axis.
|
342 videos|323 docs|185 tests
|
FAQs on Graph of Linear Equations in Two Variables - Quantitative Aptitude for SSC CGL
| 1. What are linear equations in two variables? |  |
| 2. How can I graph a linear equation in two variables? | |
| 3. What does the slope of a linear equation represent? | |
| 4. How can I determine the solution to a system of linear equations graphically? | |
| 5. Can a linear equation in two variables have more than one solution? | |


shortcuts and tricks
,Graph of Linear Equations in Two Variables | Quantitative Aptitude for SSC CGL
,Graph of Linear Equations in Two Variables | Quantitative Aptitude for SSC CGL
,past year papers
,Objective type Questions
,video lectures
,Extra Questions
,MCQs
,Free
,Previous Year Questions with Solutions
,Semester Notes
,ppt
,Viva Questions
,practice quizzes
,Graph of Linear Equations in Two Variables | Quantitative Aptitude for SSC CGL
,mock tests for examination
,Summary
,Exam
,Important questions
,study material
,Sample Paper
;


Graph of Linear Equations in Two Variables Free PDF Download
Importance of Graph of Linear Equations in Two Variables
Graph of Linear Equations in Two Variables Notes
Graph of Linear Equations in Two Variables SSC CGL Questions
Study Graph of Linear Equations in Two Variables on the App
|
© EduRev
|
Education Revolution
|


|


within 7 days!