Voltammetry, Polarography & Chromatography | Inorganic Chemistry PDF Download

Voltammetry
Voltammetry can be used for both qualitative and quantitative analysis of a wide variety of molecular and ionic materials. In this method, a set of two or three electrodes is dipped into the analyte solution, and a regularly varying potential is applied to the indicator electrode relative to the reference electrode. The analyte electrochemically reacts at the indicator electrode. The reference electrode is constructed so that its potential is constant regardless of the solution into which it is dipped. Usually a third electrode (an auxiliary or counter electrode) is placed in the solution for the purpose of carrying most of the current. The potential is controlled between the indicator electrode and the reference electrode, but the current flows between the auxiliary electrode and the indicator electrode.
Classic Polarography
The several forms of voltammetry differ in the type of varying potential that is applied to the indicator electrode. Polarography is voltammetry in which the indicator electrode is made of mercury or, rarely, another liquid metal. In classic polarography, mercury drops from a capillary tube. The surface of the mercury drop is the site of the electrochemical reaction with the analyte. The manner in which the direct-current (DC) potential of the indicator electrode varies with time is a potential (or voltage) ramp. In the most common case, the potential varies linearly with time, and the analytical method is known as linear sweep voltammetry (LSV).
Typically the potential is initially adjusted to a value at which no electrochemical reaction occurs at the indicator electrode. The potential is scanned in a direction that makes an electrochemical reaction more favourable. If reduction reactions are studied, the electrode is made more cathodic (negative); if oxidations are studied, the electrode is made more anodic (positive). Initially the current that is measured, before the electrochemical reaction begins, is small. As the electrode potential is changed, however, sufficient energy is applied to the indicator electrode to cause the reaction to take place. As the reaction occurs, electrons are withdrawn from the electrode (for electrochemical reductions) or donated to the electrode (for oxidations), and a current flows in the external electrical circuit. A voltammogram is a plot of the current as a function of the applied potential. The shape of a voltammogram depends on the type of indicator electrode and the potential ramp that are used. In nearly all cases, the voltammogram has a current wave as shown in Figure 1 or a current peak as shown in Figure 2.
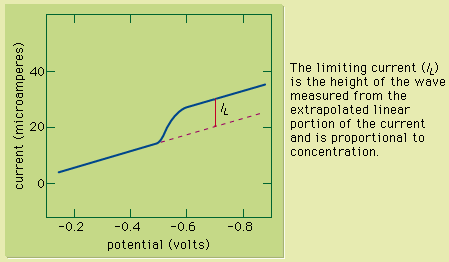 Figure 1: A voltammetric wave of copper(II) obtained by using a rotating platinum indicator electrode. The limiting current (IL) is the height of the wave measured from the extrapolated linear portion of the current and is proportional to concentration.
This technique can be used for qualitative analysis because substances exhibit characteristic peaks or waves at different potentials. The height (current) of the wave or the peak, as measured by extrapolating the linear portion of the curve prior to the wave or peak and taking the difference between this extrapolated line and the current peak or plateau, is directly proportional to the concentration of the analyte and can be used for quantitative analysis. Normally the concentration corresponding to the peak or wave height of the analyte is determined from a working curve.
Triangular Wave Voltammetry
Triangular wave voltammetry (TWV) is a method in which the potential is linearly scanned to a value past the potential at which an electrochemical reaction occurs and is then immediately scanned back to its original potential. A triangular wave voltammogram usually has a current peak on the forward scan and a second, inverted peak on the reverse scan representing the opposite reaction (oxidation or reduction) to that observed on the forward scan. Cyclic voltammetry is identical to TWV except in having more than one cycle of forward and reverse scans successively completed.
AC Voltametry
During AC voltammetry an alternating potential is added to the DC potential ramp used for LSV. Only the AC portion of the total current is measured and plotted as a function of the DC potential portion of the potential ramp. Because flow of an alternating current requires the electrochemical reaction to occur in the forward and reverse directions, AC voltammetry is particularly useful for studying the extent to which electrochemical reactions are reversible.
Pulse and Differential Pulse Voltammetry
Differential pulse voltammetry adds a periodically applied potential pulse (temporary increase in potential) to the voltage ramp used for LSV. The current is measured just prior to application of the pulse and at the end of the applied pulse. The difference between the two currents is plotted as a function of the LSV ramp potential. Pulse voltammetry utilizes a regularly increasing pulse height that is applied at periodic intervals. In pulse and differential pulse polarography the pulses are applied just before the mercury drop falls from the electrode. Typically the pulse is applied for about 50–60 milliseconds; and the current is measured during the last 17 milliseconds of each pulse. The voltammogram is a plot of the measured current as a function of the potential of the pulse. Many other variations of voltammetry also are available but are not as commonly used. Sketches showing the various potential ramps that are applied to the indicator electrode during the various types of polarography, along with the typical corresponding polarograms, are shown in Figure 3.
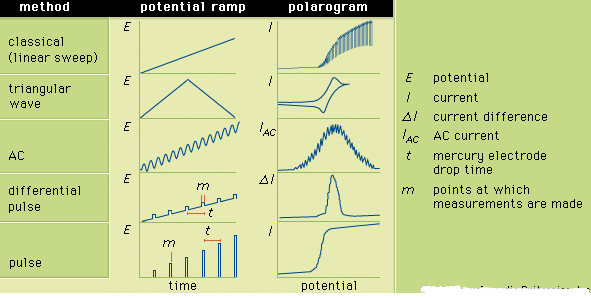 Figure 3: The potential ramps applied to the indicator electrode during selected forms of polarography and the corresponding polarograms. E is the potential; I, the current; δI, the current difference; IAC, the AC current; t, the mercury electrode drop time; and m, the points at which measurements are made.
Electrogravimetry
Electrogravimetry was briefly described above as an interference removal technique. This method employs two or three electrodes, just as in voltammetry. Either a constant current or a constant potential is applied to the preweighed working electrode. The working electrode corresponds to the indicator electrode in voltammetry and most other electroanalytical methods. A solid product of the electrochemical reaction of the analyte coats the electrode during application of the electric current or potential. After the assayed substance has been completely removed from the solution by the electrochemical reaction, the working electrode is removed, rinsed, dried, and weighed. The increased mass of the electrode due to the presence of the reaction product is used to calculate the initial concentration of the analyte.
Assays done by using constant-current electrogravimetry can be completed more rapidly (typically 30 minutes per assay) than assays done by using constant-potential electrogravimetry (typically one hour per assay), but the constant-current assays are subject to more interferences. If only one component in the solution can react to form a deposit on the electrode, constant-current electrogravimetry is the preferred method. In constant-potential electrogravimetry the potential at the working electrode is controlled so that only a single electrochemical reaction can occur. The applied potential corresponds to the potential on the plateau of a voltammetric wave of the assayed material.
Coulometry
This technique is similar to electrogravimetry in that it can be used in the constant-current or in the constant-potential modes. It differs from electrogravimetry, however, in that the total quantity of electricity (coulombs) required to cause the analyte to completely react is measured rather than the mass of the electrochemical reaction product. It is not necessary for the reaction product to deposit on the electrode in order to perform a coulometric assay; however, it is necessary that the current that flows through the electrode be ultimately used for a single electrochemical reaction. This requirement can be met in constant-current coulometry by using the current to perform a coulometric titration. In a coulometric titration, the current generates a titrant that chemically reacts with the analyte. By keeping the precursor to the titrant in excess, it is possible to ensure that all of the current is used to form the chemical reactant. Because the electrochemically formed titrant reacts completely with the analyte, it is possible to perform a quantitative analysis. Constant-potential coulometry is not subject to the effects of interferences, because the potential of the working electrode is controlled at a value at which only a single electrochemical reaction can occur.
Amperometry
During amperometric assays the potential of the indicator electrode is adjusted to a value on the plateau of the voltammetric wave, as during controlled-potential electrogravimetry and coulometry (see above). The current that flows between the indicator electrode and a second electrode in the solution is measured and related to the concentration of the analyte. Amperometry is commonly employed in two ways, both of which take advantage of the linear variation in current at constant potential with the concentration of an electroactive species. A working curve of current as a function of concentration of a series of standard solutions is prepared, and the concentration of the analyte is determined from the curve, or amperometry is used to locate the end point in an amperometric titration. An amperometric titration curve is a plot of current as a function of titrant volume. The shape of the curve varies depending on which chemical species (the titrant, the analyte, or the product of the reaction) is electroactive. In each case the curve consists of linear regions before and after the end point that are extrapolated to intersection at the end point.
Potentiometry
This is the method in which the potential between two electrodes is measured while the electric current (usually nearly zero) between the electrodes is controlled. In the most common forms of potentiometry, two different types of electrodes are used. The potential of the indicator electrode varies, depending on the concentration of the analyte, while the potential of the reference electrode is constant. Potentiometry is probably the most frequently used electroanalytical method. It can be divided into two categories on the basis of the nature of the indicator electrode. If the electrode is a metal or other conductive material that is chemically and physically inert when placed in the analyte, it reflects the potential of the bulk solution into which it is dipped. Electrode materials that are commonly used for this type of potentiometry include platinum, gold, silver, graphite, and glassy carbon.
Inert-Indicator-Electrode Potentiometry
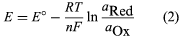
Inert-indicator-electrode potentiometry utilizes oxidation-reduction reactions. The potential of a solution that contains an oxidation-reduction couple (e.g., Fe3+ and Fe2+) is dependent on the identity of the couple and on the activities of the oxidized and reduced chemical species in the couple. For a general reduction half reaction of the form Ox + ne- → Red, where Ox is the oxidized form of the chemical species, Red is the reduced form, and n is the number of electrons (e−) transferred during the reaction, the potential can be calculated by using the Nernst equation (equation 2). In the Nernst equation E is the potential at the indicator electrode, E° is the standard potential of the electrochemical reduction (a value that changes as the chemical identity of the couple changes), R is the gas law constant, T is the absolute temperature of the solution, n is the number of electrons transferred in the reduction (the value in the half reaction), F is the faraday constant, and the aOx and aRed terms are the activities of the oxidized and reduced chemical species, respectively, in the solution. The activities can be replaced by concentrations of the ionic species if the solution is sufficiently dilute.
The most common use for potentiometry with inert-indicator electrodes is determining the end points of oxidation-reduction titrations. A potentiometric titration curve is a plot of potential as a function of the volume of added titrant. The curves have an “S” or backward “S” shape, where the end point of the titration corresponds to the inflection point.
Ion-Selective Electrodes
The second category of potentiometric indicator electrodes is the ion-selective electrode. Ion-selective electrodes preferentially respond to a single chemical species. The potential between the indicator electrode and the reference electrode varies as the concentration or activity of that particular species varies. Unlike the inert indicator electrodes, ion-selective electrodes do not respond to all species in the solution. The electrodes usually are constructed as illustrated in Figure 4. An internal reference electrode dips into a reference solution containing the assayed species and constant concentrations of the species to which the internal electrode responds. The internal reference electrode and reference solution are separated from the analyte solution by a membrane that is chosen to respond to the analyte. As usual, a second external reference electrode is also dipped into the analyte solution.
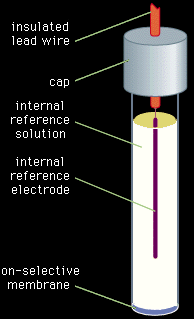 Figure 4: An ion-selective electrode for use in potentiometric measurements.
The selectivity of the ion-selective electrodes results from the selective interaction between the membrane and the analyte. The electrodes are categorized according to the nature of the membrane. The most common types of ion-selective electrodes are the glass, liquid-ion-exchanger, solid-state, neutral-carrier, coated-wire, field-effect transistor, gas-sensing, and biomembrane electrodes. The glass membranes in glass electrodes are designed to allow partial penetration by the analyte ion. They are most often used for pH measurements, where the hydrogen ion is the measured species.
Liquid-ion-exchanger electrodes utilize a liquid ion exchanger that is held in place in an inert, porous hydrophobic membrane. The electrodes are selective because the ion exchangers selectively exchange a single analyte ion. Solid-state ion-selective electrodes use a solid sparingly soluble, ionically conducting substance, either alone or suspended in an organic polymeric material, as the membrane. One of the ions in the solid generally is identical to the analyte ion; e.g., membranes that are composed of silver sulfide respond to silver ions and to sulfide ions. Neutral-carrier ion-selective electrodes are similar in design to the liquid-ion-exchanger electrodes. The liquid ion exchanger, however, is replaced by a complexing agent that selectively complexes the analyte ion and thereby draws it into the membrane.
Coated-wire electrodes were designed in an attempt to decrease the response time of ion-selective electrodes. They dispense with the internal reference solution by using a polymeric membrane that is directly coated onto the internal reference electrode. Field-effect transistor electrodes place the membrane over the gate of a field-effect transistor. The current flow through the transistor, rather than the potential across the transistor, is monitored. The current flow is controlled by the charge applied to the gate, which is determined by the concentration of analyte in the membrane on the gate.
Gas-sensing electrodes are designed to monitor dissolved gases. Typically they consist of an internal ion-selective electrode of one of the designs previously described (usually a glass electrode), which has a second, gas-permeable membrane wrapped around the membrane of the internal electrode. Between the membranes is an electrolyte solution containing ions that correspond to a reaction product of the analyte gas. For example, an ammonia-selective electrode can be constructed by using an internal glass pH electrode and an ammonium chloride solution between the membranes. The ammonia from the sample diffuses into the ammonium chloride solution between the membranes and partially dissociates in the aqueous solution to form ammonium ions and hydroxide ions. The internal pH electrode responds to the altered pH of the solution caused by the formation of hydroxide ions.
Biomembrane electrodes are similar in design to gas-sensing electrodes. The outer permeable membrane is used to hold a gel between the two membranes. The gel contains an enzyme that selectively catalyzes the reaction of the analyte. The internal ion-selective electrode is chosen to respond to one of the products of the catalyzed reaction. Internal pH electrodes are commonly used.
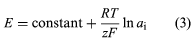
In the absence of electrode interferences from other ions, ion-selective electrodes usually obey equation (3), where E is the potential measured between the electrode and a reference electrode, z is the charge on the analyte ion, ai is the activity of the ion, and the other terms represent the same terms as given above for the Nernst equation.
Quantitative analysis of all ions except hydrogen generally is performed by using the working curve method. A working curve is prepared by plotting the potential of a series of standard solutions as a function of the logarithm or natural logarithm (ln) of the activities or concentrations of the solutions. The activity or concentration of the analyte is determined from the curve.
Normally pH measurements are performed with a modified voltmeter called a pH meter. Buffer solutions of known pH are used to standardize the instrument. After standardization, the electrodes are dipped into the analyte and the pH of the solution is displayed. A similar approach can be used in place of the working curve method to determine the concentration of ions other than the hydrogen ion by using standard solutions to adjust the meter.
Separatory Methods
The final major category of instrumental methods is the separatory methods. Chromatography and mass spectrometry are two such methods that are particularly important for chemical analysis. (See chromatography and mass spectrometry for more detailed treatments of these subjects.)
Chromatography
Chromatography was described earlier as a method for removing interferences prior to an analysis. Both gas and liquid chromatographic methods can be used for chemical analysis.
Gas Chromatography
In gas chromatography the stationary phase is contained in a column. The column generally is a coiled metallic or glass tube. An injector near the entrance to the column is used to add the analyte. The mobile phase gas usually is contained in a high pressure gas cylinder that is attached by metallic tubing to the injector and the column. A detector, placed at the exit from the column, responds to the separated components of the analyte. The detector is electrically attached to a recorder or other readout device (e.g., a computer) that displays the detector response as a function of time. The plot of the detector response as a function of time is a chromatogram. Each separated component of the analyte appears as a peak on the chromatogram.
Qualitative analysis is performed by comparing the time required for the component to pass through the column with the corresponding times for known substances. The interval between the instant of injection and the detection of the component is known as the retention time. Because retention times vary with the identity of the component, they are utilized for qualitative analysis. Quantitative analysis is performed by preparing a working curve, at a specific retention time, by plotting the peak height or peak area of a series of standards as a function of the concentration of the component being assayed. The concentration of the component in the analyte is determined from the chromatographic peak height or area of the component and the working curve.
Liquid Chromatography
This procedure can be performed either in a column or on a plane. Columnar liquid chromatography is used for qualitative and quantitative analysis in a manner similar to the way in which gas chromatography is employed. Sometimes retention volumes, rather than retention times, are used for qualitative analysis. For chemical analysis the most popular category of columnar liquid chromatography is high-performance liquid chromatography (HPLC). The method uses a pump to force one or more mobile phase solvents through high-efficiency, tightly packed columns. As with gas chromatography, an injection system is used to insert the sample into the entrance to the column, and a detector at the end of the column monitors the separated analyte components.
The stationary phase that is used for plane chromatography is physically held in place in or on a plane. Typically the stationary phase is attached to a plastic, metallic, or glass plate. Occasionally, a sheet of high-quality filter paper is used as the stationary phase. The sample is added as a spot or a thin strip at one end of the plane. The mobile phase flows over the spot by capillary action during ascending development or as a result of the force of gravity during descending development. During ascending development, the end of the plane near and below the sample spot is dipped into the mobile phase, and the mobile phase moves up and through the spot. During descending development, the mobile phase is added to the top of the plane and flows downward through the spot.
Qualitative analysis is performed by comparing the retardation factor (Rf) of the analyte components with the retardation factors of known substances. The retardation factor is defined as the distance from the original sample spot that the component has moved divided by the distance that the mobile phase front has moved and is constant for a solute in a given solvent. Quantitative analysis is performed by measuring the sizes of the developed spots, by measuring some physical property of the spots (such as fluorescence), or by removing the spots from the plane and assaying them by another procedure.
Mass Spectrometry
This is the analytical method in which ions or ionic fragments of an analyte are separated based on mass-to-charge ratios (m/z). Most mass spectrometers have four major components: an inlet system, an ion source, a mass analyzer, and a detector. The inlet system is used to introduce the analyte and to convert it to a gas at reduced pressure. The gaseous analyte flows from the inlet system into the ionic source of the instrument where the analyte is converted to ions or ionic fragments. That is often accomplished by bombarding the analyte with electrons or by allowing the analyte to undergo collisions with other ions.
The ions that are formed in the ionic source are accelerated into the mass analyzer by a system of electrostatic slits. In the analyzer the ions are subjected to an electric or magnetic field that is used to alter their paths. In the most common mass analyzers the ions are separated in space according to their mass-to-charge ratios. In time-of-flight mass analyzers, however, no electric or magnetic field is employed, and the time required for ions of varying m/z that are accelerated to the same kinetic energy to pass through a flight tube is measured. The detector is placed at the end of the mass analyzer and measures the intensity of the ionic beam. A mass spectrum is a plot of the ionic beam intensity as a function of the mass-to-charge ratio of the ionic fragment.
Mass spectrometry is used for quantitative analysis by relating the height of a specific mass spectrometric peak to the concentration of the analyte. The peak heights vary linearly with concentration. Qualitative analysis is performed by using the entire spectrum. Generally the major peak with the largest m/z is the molecular ion peak that has a charge of +1, corresponding to the loss of a single electron. Consequently, the m/z of the peak corresponds to the molecular weight of the analyte. The spacing between peaks is used to deduce the manner in which the analyte has fragmented in the ionic source. By carefully examining the fragmentation pattern, it is possible to deduce the structure of the analyte molecule. Computerized comparisons of analyte mass spectra with mass spectra of known materials is commonly used to identify an analyte.
|
50 videos|92 docs|41 tests
|
FAQs on Voltammetry, Polarography & Chromatography - Inorganic Chemistry
| 1. What is the principle of voltammetry? |  |
| 2. How does polarography differ from voltammetry? | |
| 3. What is the role of a stationary phase in chromatography? | |
| 4. How does chromatography separate different compounds? | |
| 5. What are the advantages of using chromatography in chemical analysis? | |


Viva Questions
,Objective type Questions
,practice quizzes
,Previous Year Questions with Solutions
,Polarography & Chromatography | Inorganic Chemistry
,Polarography & Chromatography | Inorganic Chemistry
,Semester Notes
,Voltammetry
,Sample Paper
,Important questions
,Summary
,MCQs
,ppt
,Exam
,Voltammetry
,mock tests for examination
,Voltammetry
,past year papers
,shortcuts and tricks
,Free
,video lectures
,study material
,Polarography & Chromatography | Inorganic Chemistry
,Extra Questions
;


Voltammetry, Polarography & Chromatography Free PDF Download
Importance of Voltammetry, Polarography & Chromatography
Voltammetry, Polarography & Chromatography Notes
Voltammetry, Polarography & Chromatography Chemistry Questions
Study Voltammetry, Polarography & Chromatography on the App
|
© EduRev
|
Education Revolution
|


|


within 7 days!