Class 5 Maths - Data Handling - Question Answers
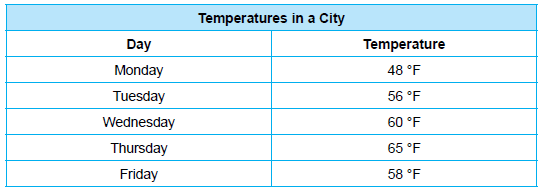
1. The table below shows daily temperatures for a city recorded for 5 days in degrees Fahrenheit.

Q1: What is the temperature recorded on Wednesday?
Ans: The temperature recorded on Wednesday is 60°F.
The table clearly shows that the temperature on Wednesday is 60°F, and this value is mentioned in the column under "Temperature."
Q2: On which day was the highest temperature recorded?
Ans: The highest temperature was recorded on Thursday.
The table shows that the temperature on Thursday was 65°F, which is the highest temperature among the five days listed.
Q3: Which day showed a decrease in temperature compared to the previous day?
Ans: The temperature decreased on Friday.
The temperature on Thursday was 65°F, but it dropped to 58°F on Friday. This decrease is shown in the temperature values in the table.
Q4: What is the difference in temperature between Monday and Tuesday?
Ans: The difference in temperature between Monday and Tuesday is 8°F.
On Monday, the temperature was 48°F, and on Tuesday, it was 56°F. The difference is:
56°F−48°F=8°F
This is confirmed by the values in the table.
Q5: Describe the trend in temperatures over the 5 days.
Ans: The temperature increased from Monday to Thursday and then decreased on Friday.
According to the table, the temperature started at 48°F on Monday and rose steadily to 65°F on Thursday. However, it dropped to 58°F on Friday. This upward trend followed by a slight decrease can be observed by looking at the temperature values across the days.
2. The table below shows Ram’s weight in kilograms for 5 months.

Q1: What was Ram's weight in January?
Ans: Ram's weight in January was 35 kg.
The table shows that Ram's weight in January is 35 kg, as listed in the "Weight in (kg)" row under the "January" column.
Q2: In which month did Ram's weight reach 40 kg?
Ans: Ram's weight reached 40 kg in April.
The table shows that in April, Ram's weight was recorded as 40 kg.
Q3: What is the difference in Ram's weight between February and March?
Ans: The difference in Ram's weight between February and March is 1 kg.
According to the table, Ram's weight in February was 38 kg, and in March it was 39 kg. The difference is:
39kg−38kg=1kg
Q4: By how many kilograms did Ram's weight increase from January to May?
Ans: Ram's weight increased by 7 kg from January to May.
Ram's weight in January was 35 kg, and in May it was 42 kg. The increase is:
42kg−35kg=7kg
Q5: Describe the trend in Ram's weight over the 5 months.
Ans: Ram's weight increased steadily from January to May.
The table shows that Ram's weight increased month by month, starting from 35 kg in January and reaching 42 kg in May. This shows a consistent upward trend in his weight over the 5-month period.
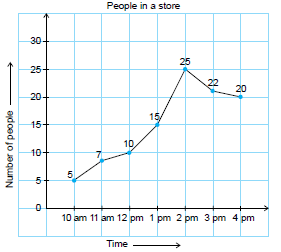
3. The line graph below shows people in a store at various times of the day.

Observe the line graph and answer the following questions:
Q1: What information does the line graph depict?
Ans: The line graph shows the number of people in a store from 10 am to 4 pm.
The title and labels of the graph indicate that it represents how many people were in the store at different times throughout the day.
Q2: What is the busiest time of day at the store?
Ans: The busiest time of day at the store is 2 pm.
The graph peaks at 2 pm, showing the highest number of people (25) in the store at that time.
Q3: How many people are there in the store when it opens?
Ans: There are 5 people in the store when it opens.
At 10 am, when the store opens, the line graph shows that 5 people are in the store.
Q4: What was the greatest number of people in the store?
Ans: The greatest number of people in the store was 25.
The highest point on the line graph occurs at 2 pm, where the number of people is 25. This is the maximum number of people present in the store during the day.
|
96 videos|462 docs|47 tests
|
FAQs on Class 5 Maths - Data Handling - Question Answers
| 1. What is data handling and why is it important in everyday life? |  |
| 2. What are the basic steps involved in data handling? |  |
| 3. How can data handling skills be applied in various professions? |  |
| 4. What tools or software are commonly used for data handling? |  |
| 5. How can one improve their data handling skills? |  |


