Data Handling Class 1 Notes Maths Chapter 9
| Table of contents |

|
| What Is Data Handling? |

|
| Why We Do Data Handling |

|
| Steps to Handle Data |

|
| 1. Counting Birds |

|
| 2. Picture Graph of Toys |

|
| 3. Sorting Vegetables |

|
What Is Data Handling?
- Data is information we collect (like counts of birds, fish, or toys).
- Handling means organizing and understanding that information.
Why We Do Data Handling
In maths, we often:
Collect data by counting objects or people.
Record it with pictures (pictographs) or numbers (numerals).
Interpret it by answering questions about what we recorded.
Below is one such example of Collecting, Recording and Interpreting Data of number of students going to school by Bus, Car, Bicycle or Walk
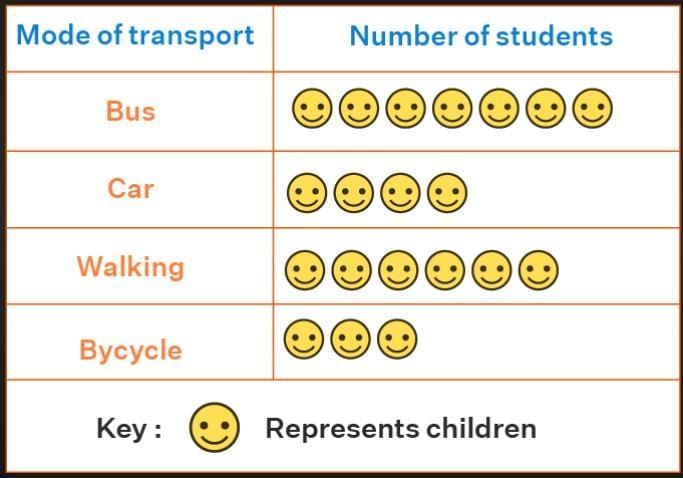 Example Data Handling
Steps to Handle Data
- Look at a picture or real-life scene.
- Count each type of item carefully.
- Write a little picture or number for each group.
- Answer questions about what you counted.
1. Counting Birds
Look at the picture of birds below.
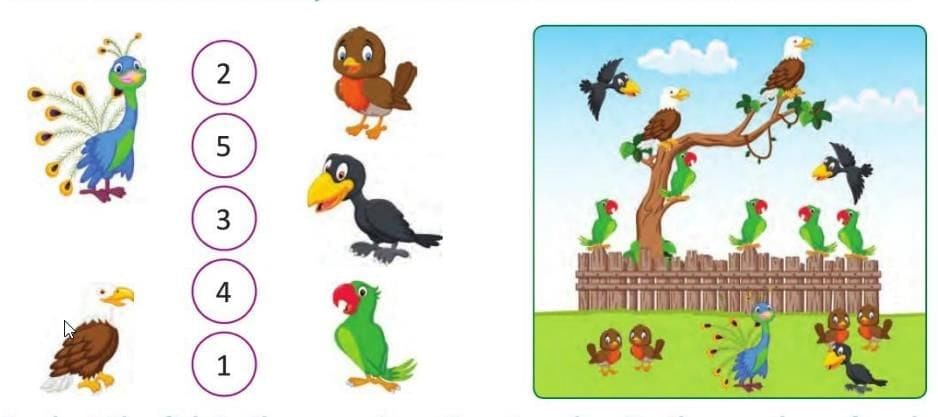
- Count how many of each kind you see.
- Match with their numbers.
2. Picture Graph of Toys
- A toy shop shows many different toys.
- This drawing is called a picture graph.
- Each toy picture stands for one toy in the shop.
We can see at a glance which toy there is most of, and which toy is least.
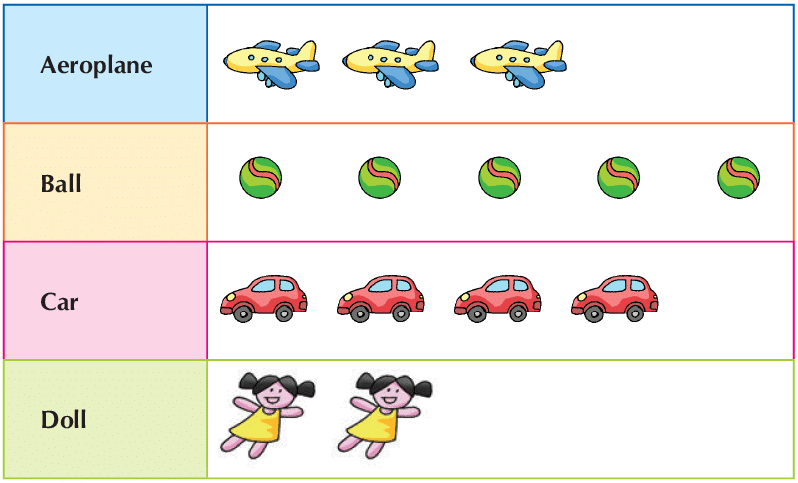 Picture Graph
3. Sorting Vegetables
Sorting means putting similar things together so they are easy to count.
Here is how you can understand it:
Mother: Jiya, please help me in sorting vegetables in the basket. Jiya did it like this.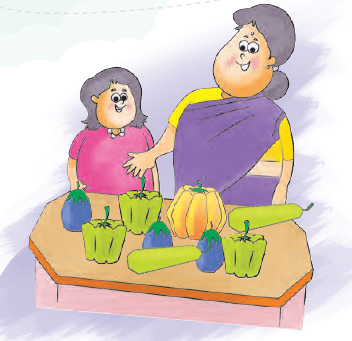 Jiya with her mother
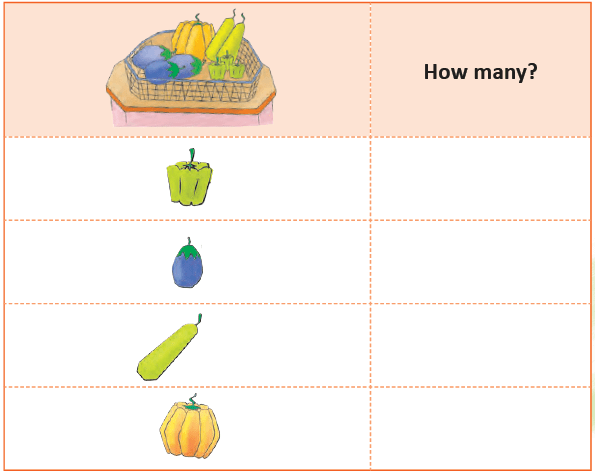
Mother: Sorting will help me know quickly how many of each are there. Look at the vegetables in Jiya's basket and write how many are of each type.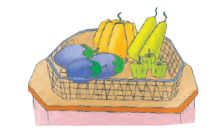
EduRev Tips: Sorting helps in organising things or information.
|
16 videos|224 docs|23 tests
|
FAQs on Data Handling Class 1 Notes Maths Chapter 9
| 1. What is data handling? |  |
| 2. What is a picture graph? |  |
| 3. What is the purpose of sorting data? |  |
| 4. How can picture graphs be used in data handling? |  |
| 5. What are some advantages of using picture graphs? |  |


