Material Cost: Notes- 1 - CA Intermediate PDF Download
Chapter Overview
Introduction
We have acquired a basic knowledge about the concepts, objectives, advantages, methods and elements of cost. We shall now study each element of cost separately beginning with material cost. The general meaning of material is all commodities/ physical objects used to make the final product. It may be direct or indirect.
- Direct Materials: Materials, cost of which can be directly attributable to the end product for which it is being used, in an economically feasible way.
- Indirect Materials: Those materials which are not directly attributable to a particular final product.
Direct Materials constitute a significant part for manufacturing and production of goods. Being an input and a significant cost element, it requires adequate management attention. Cost control starts from here, and for this purpose it is necessary that the principle of 3Es (Economy, Efficiency and Effectiveness) i.e. economy in procurement, efficiency in handling and processing the material and effectiveness in producing desired output as per the standard, is also applied for this cost element. Importance of proper recording and control of material are as follows:
- Quality of final product: The quality of output depends on the quality of inputs.
- Price of the final product: Material constitutes a significant part of any product and the cost of final product is directly related with cost of materials used to produce the product.
- Production continuity: The production firms need to ensure that production process runs smoothly and should not be paused for the want of materials. In order to avoid production interruptions, an adequate level of stock of materials should be maintained.
- Cost of Stock holding and stock-out: An entity has to incur stock holding costs in the form of interest and/or opportunity cost for the fund used, stock handling losses like evaporation, obsolescence etc. Under-stocking causes in loss of revenue due to stock-out and breach of commitment.
- Wastage and other losses: While handling and processing of materials, some wastage and loss arise. Based on the nature of material and process, these are classified as normal and abnormal for efficient utilisation and control.
- Regular information about resources: Regular and updated information on availability and utilisation of materials are necessary for the entity for timely and informed decision making.
Material Control
In the previous chapter, we have discussed the term Cost Control, which means all activities and control mechanism which are necessary to keep the cost in adherence to the set standards. Material, being one of the total cost elements, are also required to be controlled so that the overall cost control objective can be fulfilled.
Objectives of System of Material Control
The objectives of a system of material control are as following:
- Minimising interruption in production process: Material Control system ensures that no activity, particularly production, suffers from interruption for want of materials and stores. It should be noted that this requires constant availability of every item that may be needed in production process, howsoever, small its cost may be.
- Optimisation of Material Cost: The overall material costs includes price, ordering costs and holding costs. Since all the materials and stores are acquired at the lowest possible price considering the required quality and other relevant factors like reliability in respect of delivery, etc., holding cost too needs to be minimized.
- Reduction in Wastages: Material Control System has an objective of avoidance of unnecessary losses and wastages that may arise from deterioration in quality due to defective or long storage or from obsolescence. It may be noted that losses and wastages in the process of manufacture are a concern of the production department.
- Adequate Information: The system of material control maintains proper records to ensure that reliable information is available for all items of materials and stores. This not only helps in detecting losses and pilferages but also facilitates proper production planning.
- Completion of order in time: Proper material management is very necessary for fulfilling orders of the firm. This adds to the goodwill of the firm.
Requirements of Material Control
Material control requirements can be summarised as follows:
- Proper co-ordination of all departments involved viz., finance, purchasing, receiving, inspection, storage, accounting and payment.
- Determining purchase procedure to see that purchases are made, after making suitable enquiries, at the most favourable terms to the firm.
- Use of standard forms for placing the order, noting receipt of goods, authorising issue of the materials etc.
- Preparation of budgets concerning materials, supplies and equipment to ensure economy in purchasing and use of materials.
- Operation of a system of internal check so that all transactions involving materials, supplies and equipment purchases are properly approved and automatically checked.
- Storage of all materials and supplies in a well designated location with proper safeguards.
- Operation of a system of perpetual inventory together with continuous stock checking so that it is possible to determine, at any time, the amount and the value of each kind of material in stock.
- Operation of a system of stores control and issue so that there will be delivery of materials upon requisition to departments in the right amount at the time they are needed.
- Development of system of controlling accounts and subsidiary records which exhibit summary and detailed material costs at the stage of material receipt and consumption.
- Regular reports of materials purchased issue from stock, inventory balances, obsolete stock, goods returned to vendors, and spoiled or defective units are required.
Elements of Material Control
Material control is a systematic control over the procurement, storage and usage of material so as to maintain an even flow of material.
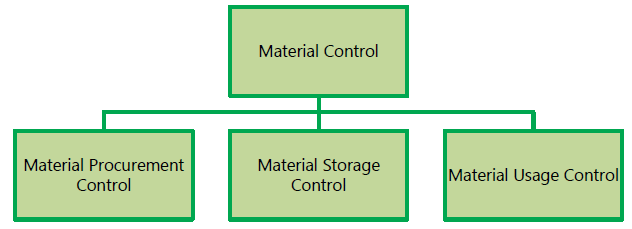
Material control involves efficient functioning of the following operations:
- Purchasing of materials
- Receiving of materials
- Inspection of materials
- Storage of materials
- Issuing materials
- Maintenance of inventory records
- Stock audit
Materials Procurement Procedure
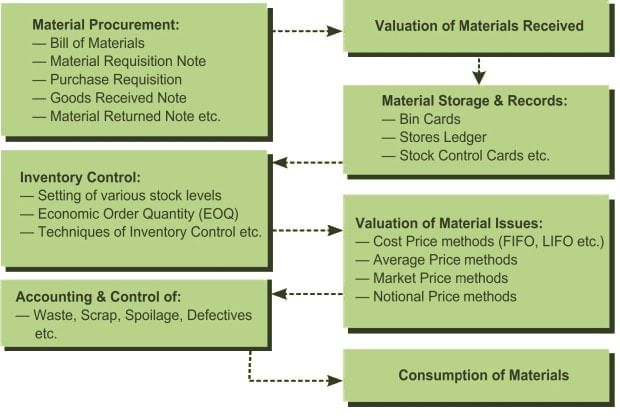
Material procurement procedure can be understood with help of the following diagram. Documents required and the departments who initiate these documents
are shown sequentially.
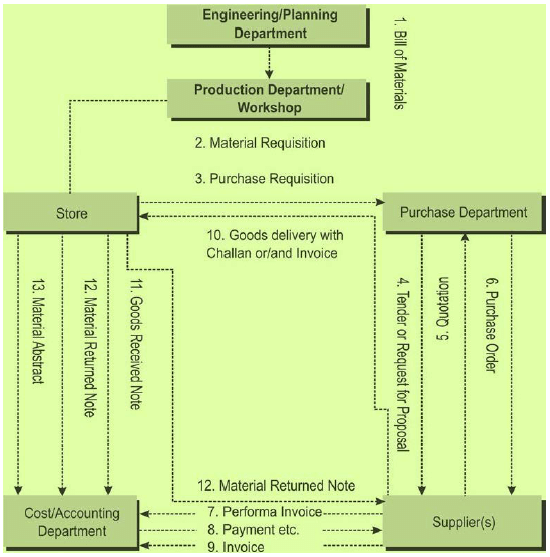 Material Procurement Procedure
Bill of Materials
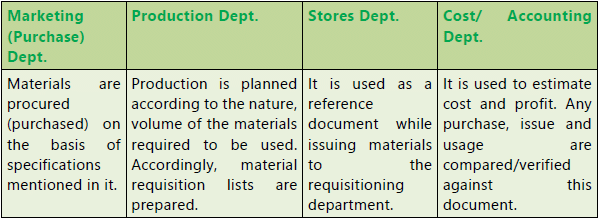
It is also known as Materials Specification List or Materials List. It is a detailed list specifying the standard quantities and qualities of materials and components required for producing a product or carrying out of any job. The materials specification list is prepared by the product development team commonly known as engineering or planning department in a standard form. This is shared with other concerned departments like Marketing, Production, Store, and Cost/ Accounting department.
Format and content of a Bill of Materials vary on the basis of industrial peculiarities, management information system (MIS) and accounting system in place.
Uses of Bill of Material
Material Requisition Note
It is also known as material requisition slip . It is a voucher of authority used to get materials issued from store. Generally, it is prepared by the production department and materials are withdrawn on the basis of material requisition list or bill of materials. If no material list has been prepared, it is desirable that the task of the preparation of material requisition notes be left to the planning department or by the department requires the materials. The note is shared with Store and Cost/ Accounting department.
Format of a Material requisition note may vary on the basis of industrial peculiarities, management information system (MIS) and accounting system in place.
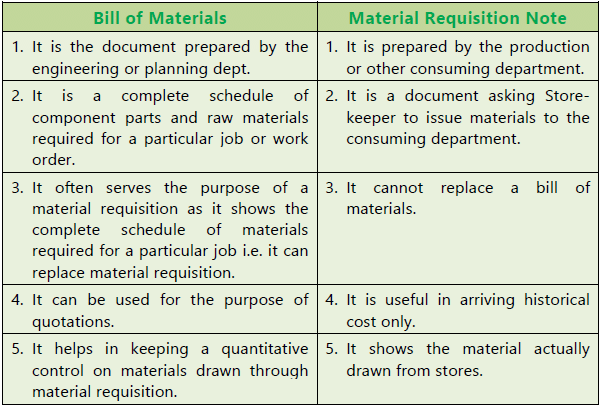
Difference between Bill of Materials and Material Requisition Note:
Purchase Requisition
- This is a document which authorises the purchase department to order for the materials specified in the note. Since the materials purchased will be used by the production departments, there should be constant co-ordination between the purchase and production departments. A purchase requisition is a form used for making a formal request to the purchasing department to purchase materials. This form is usually filled up by the store keeper for regular materials and by the departmental head for special materials (not stocked as regular items).
- At the beginning a complete list of materials and stores required should be drawn up, which should be reviewed periodically for any addition or deletion. On the basis of standing order, once an item is included in the standard list, it becomes the duty of the purchase department to arrange for fresh supplies before existing stocks are exhausted. Any change in the consumption pattern should be informed to the purchase department for necessary action from their end.
- For control over buying of regular store materials, Inventory control system is to determine stock levels to be maintained and the number of quantities to be
- ordered. In respect of special materials, required for a special order or purpose, it is desirable that the concerned technical department should prepare materials specifications list specifying the quantity, size and order for the materials.
- Purchase requisition note may either be originated by the stores department in connection with regular materials or by the production planning or other technical departments in respect of special materials.
- Format of a purchase requisition note may vary on the basis of industrial peculiarities, management information system (MIS) and accounting system in place.
Inviting Quotation/Request for Proposal (RFP)
After receipt of duly authorised purchase requisition from the store department or other departments, role of purchase department comes into play. If a concern can afford or the size of the concern is big enough, there should be a separate purchase department for all purchases to be made on behalf of all other departments. Such a department is bound to become expert in the various matters to be attended to, for examples— units of materials to be purchased and licences to be obtained, transport, sources of supply, probable price etc.
Materials purchase department in a business house is confronted with the following issues:
- What to purchase?
- When to purchase?
- How much to purchase?
- From where to purchase.
- At what price to purchase.
To overcome these questions, purchase department make an enquiry into the market for the required material. The process of gathering information about the rate, quantity, technology, services and support etc., purchase department sends RFP to the selected vendors in case if purchase policy allows this practice. Some organizations follow the open and transparent purchase policy and invite quotations from the interested vendors. This process is called Tender Notification or Invitation of Tender.
Selection of Quotation/ Proposal
After invitation of tender from the vendors, interested vendors who are fulfilling all the criteria mentioned in the tender notice send their price quotations/ proposals to the purchase department. On the receipt of quotations, a comparative statement is prepared. For selecting material suppliers, the factors which the purchase department keeps in its mind are—price, quantity, quality offered, time of delivery, mode of transportation, terms of payment, reputation of supplier etc. In addition to the above listed factors purchase manager obtains other necessary information for final selection of material suppliers.
Preparation and Execution of Purchase Orders
Having decided on the best quotation that should be accepted, the purchase manager or concerned officer proceeds to issue the formal purchase order. It is a written request to the supplier to supply specified materials at specified rates and within a specified period. Generally, copies of purchase order are given to Store or order indenting department, receiving department and cost accounting department. A copy of the purchase order with relevant purchase requisitions, is held in the file of the department to facilitate the follow-up of the delivery and also for approval of the invoice for payment.
Receipt and Inspection of Materials
After execution of purchase order and advance payment (if terms of quotation so specify), necessary arrangement is made to receive the delivery of materials After receipt of materials along with relevant documents or/ and invoice, receiving department (store dept.) arrange to inspect the materials for its conformity with purchase order. After satisfactory inspection, materials are received and Goods Received Note is issued. If some materials are not found in good condition or are not in conformity with the purchase order are returned back to the vendor along with a Material Returned Note.
- Goods Received Note
If everything is in order and the supply is considered suitable for acceptance, the Receiving department prepares a Receiving Report or Material Inward Note or Goods Received Note. Generally, it is prepared in quadruplicate, the copies being distributed to purchase department, store or order indenting department, receiving department and accounting department. - Material Returned Note
Sometimes materials have to be returned to suppliers after these have been received in the factory. Such returns may occur before or after the preparation of the receiving report. If the return takes place before the preparation of the receiving report, such material obviously would not be included in the report and hence not shown in the stores ledgers. In that case, no adjustment in the account books would be necessary. But if the material is returned after its entry in the receiving report, a suitable document must be drawn up in support of the issue so as to exclude from the Stores of Material Account the value of the materials returned back. This document usually takes the form of a Material Returned Note or Material outward return note.
Checking and Passing of Bills for Payment:
The invoice received from the supplier is sent to the accounts section to check authenticity and mathematical accuracy. The quantity and price are also checked
with reference to goods received note and the purchase order respectively. The accounts section after checking its accuracy finally certifies and passes the invoice for payment.
Valuation of Material Receipts
After the procurement of materials from the supplier actual material cost is
calculated. Ascertainment of cost of material purchased is called valuation of materials receipts. Cost of material includes cost of purchase net of trade discounts, rebates, duty draw-back, input credit availed, etc. and other costs incurred in bringing the inventories to their present location and condition. Invoice of material purchased from the market sometime contain items such as trade discount, quantity discount, freight, duty, insurance, cost of containers, taxes, cash discount etc. Treatment of items associated with purchase of materials is tabulated as below

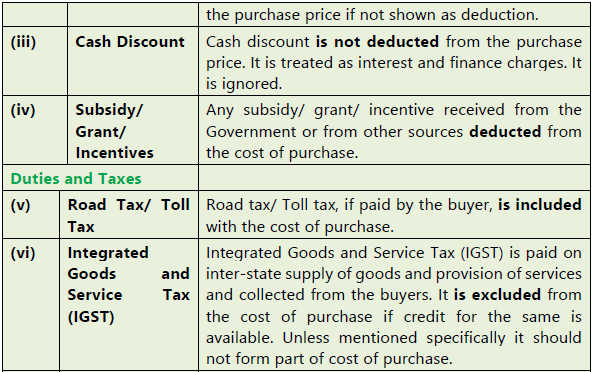
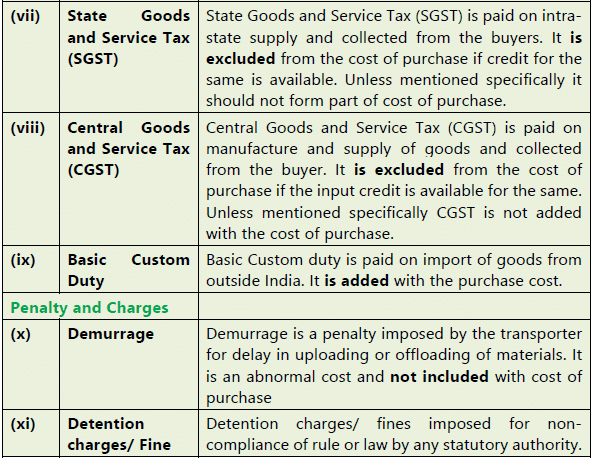
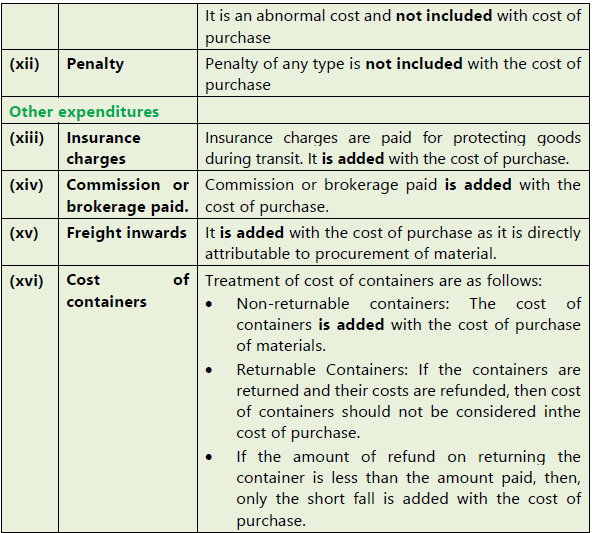
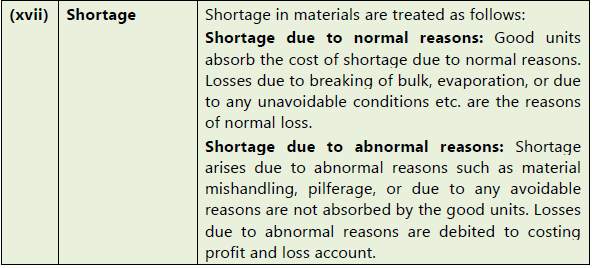
Illustration: 1
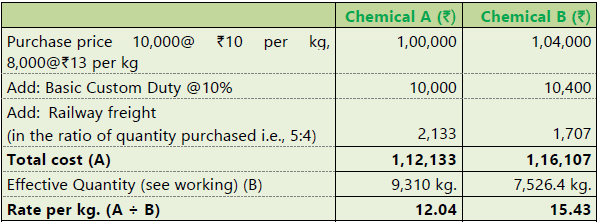
An invoice in respect of a consignment of chemicals A and B provides the following information:

A shortage of 500 kgs. in chemical A and 320 kgs. in chemical B is noticed due to normal breakages. You are required to COMPUTE the rate per kg. of each chemical, assuming a provision of 2% for further deterioration.
Working:
Computation of effective quantity of each chemical available for use
Statement showing the computation of rate per kg. of each chemical
Illustration: 2
At WHAT price per unit would Part No. A 32 be entered in the Stores Ledger, if the
following invoice was received from a supplier: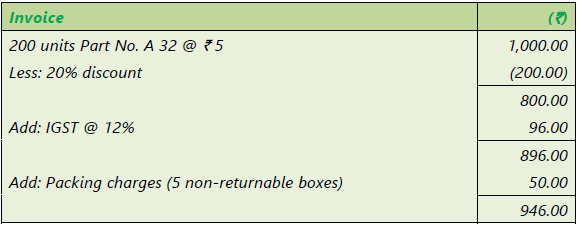
- A 2 per cent cash discount will be given if payment is made in 30 days.
- Documents substantiating payment of IGST are enclosed for claiming Input credit.
Computation of cost per unit
Note:
- Cash discount is treated as interest and finance charges, hence, it is not considered for valuation of material.
- Input credit is available for IGST paid; hence it will not be added to purchase cost.
 |
Download the notes
Material Cost: Notes- 1
|
Download as PDF |
Material Storage & Records
Proper storing of materials is of primary importance. It is not enough only to purchase material of the required quality. If the purchased material subsequently deteriorates in quality because of bad storage, the loss is even more than what might arise from purchase of bad quality of materials. Apart from preservation of quality, the store-keeper also ensures safe custody of the material. It should be the function of store-keeper that the right quantity of materials always should be available in stock.
Duties of Store Keeper
These can be briefly set out as follows:
- General control over store: Store keeper should keep control over all activities in Stores department. He should check the quantities as mentioned in Goods received note and with the purchased materials forwarded by the receiving department and to arrange for the storage in appropriate places.
- Safe custody of materials: Store keeper should ensure that all the materials are stored in a safe condition and environment required to preserve the quality of the materials.
- Maintaining records: Store keeper should maintain proper record of quantity received, issued, balance in hand and transferred to/ from other stores.
- Initiate purchase requisition: Store keeper should initiate purchase requisitions for the replacement of stock of all regular stores items whenever the stock level of any item of store approaches the re-order level fixed.
- Maintaining adequate level of stock: Store keeper should maintain adequate level of stock at all time. He/ she should take all the necessary action so that production could not be interrupted due to lack of stock. Further he/ she should take immediate action for stoppage of further purchasing when the stock level approaches the maximum limit. He also needs to reserve a particular material for a specific job when so required.
- Issue of materials: Store keeper should issue materials only against the material requisition slip approved by the appropriate authority. He/ she should also refer to bill of materials while issuing materials to requisitioning department.
- Stock verification and reconciliation: Store keeper should verify the book balances with the actual physical stock at frequent intervals by way of internal control and check the any irregular or abnormal issues, pilferage, etc.
Store Records
The record of stores may be maintained in three forms:
- Bin Cards
- Stock Control Cards
- Store Ledger
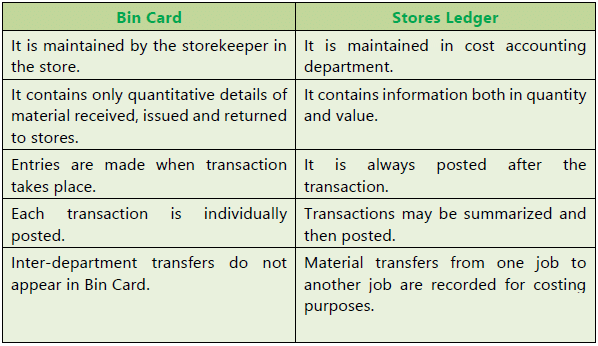
Bin Cards: It is a quantitative record of inventory which shows the quantity of inventory available in a particular bin. Bin refers to a box/ container/ space where materials are kept. Card is placed with each of the bin (space) to record the details of material like receipt, issue and return. It is maintained by store department.
Stock Control Cards: It is also a quantitative record of inventory maintained by stores department for every item of material. In other words, it is a record which shows the overall inventory position in store. Recording includes receipt, issue, return, in hand and order given.
Advantages and Disadvantages of Bin Cards
Advantages:
- There would be fewer chances of mistakes being made as entries are made at the same time as goods received or issued by the person actually handling the materials.
- Control over stock can be more effective, as comparison of the actual quantity in hand at any time with the book balance is possible.
- Identification of the different items of materials is facilitated by reference to the Bin Card, the bin or storage receptacle.
Disadvantages:
- Store records are dispersed over a wide area.
- The cards are liable to be smeared with dirt and grease because of proximity to material and also because of handling materials.
- People handling materials are not ordinarily suitable for the clerical work involved in writing Bin Cards.
Advantages and Disadvantages of Stock Control Cards
Advantages:
- Records are kept in a more compact manner so that reference to them is facilitated.
- Records can be kept in a neat and clean way by men solely engaged in clerical work so that a division of workers between record keeping and actual material handling is possible.
- As the records are at one place, it is possible to get an overall idea of the stock position without the necessity of going round the stores.
Disadvantages:
- On the spot comparison of the physical stock of an item with its book balance is not facilitated.
- Physical identification of materials in stock may not be as easy as in the case of bin cards, as the Stock Control Cards are housed in cabinets or trays.
Stores Ledger: A Stores Ledger is maintained to record both quantity and cost of materials received, issued and those in stock. It is a subsidiary ledger to the main cost ledger ;it is maintained by the Cost/ Accounts Department. The source documents for posting the ledger are Goods received notes, Materials requisition notes etc.
The first two forms are records of quantities received, issued and those in balance, but in the third record i.e. store ledger, value of receipts, issues and closing balance is also maintained. Usually, records of quantities i.e. Bin cards and Store Control Cards are kept by the store keeper in store department while record of both quantity and value is maintained by cost accounting department.
Difference between Bin Card & Stores Ledger
Inventory Control
The Chartered Institute of Management Accountants (CIMA) defines Inventory Control as “The function of ensuring that sufficient goods are retained in stock to meet all requirements without carrying unnecessarily large stocks.”
The objective of inventory control is to make a balance between sufficient stock and over-stock. The stock maintained should be sufficient to meet the production requirements so that uninterrupted production flow can be maintained. Insufficient stock not only pause the production but also cause a loss of revenue and goodwill.
On the other hand, inventory requires some funds for purchase, storage, maintenance of materials with a risk of obsolescence, pilferage etc. The main objective of inventory control is to maintain a trade-off between stock-out and over-stocking. The management may employ various methods of inventory control to have a balance. Management may adopt the following basis for inventory control:

Inventory Control- By Setting Quantitative Levels
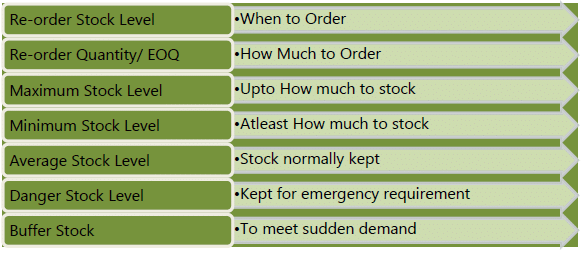
(i) Re-order Stock Level (ROL): This level lies between minimum and the maximum levels in such a way that before the material ordered is received into the stores, there is sufficient quantity in hand to cover both normal and abnormal consumption situations. In other words, it is the level at which fresh order should be placed for replenishment of stock.
It is calculated as:
ROL = Maximum Consumption × Maximum Re-order Period
- Maximum Consumption = The maximum rate of material consumption in production activity
- Maximum Re-order period = The maximum time to get order from supplier to the stores
- This can also be calculated alternatively as below:
ROL = Minimum Stock Level + (Average Rate of Consumption ×Average Re-order period)
- Minimum Stock Level = Minimum Stock level that must be maintained all the time.
- Average Rate of Consumption = Average rate of material consumption in production activity. It is also known as normal consumption/ usage
- Average Re-order period = Average time to get an order from supplier to the stores. It is also known as normal period.
(Re-order period is also known as Lead time)
(ii) Re-Order Quantity: Re-order quantity is the quantity of materials for which purchase requisition is made by the store department. While setting the quantity to be re-ordered, consideration is given to the maintenance of minimum level of stock, re-order level, minimum delivery time and the most important the cost. Hence, the quantity should be where, the total of carrying cost and ordering cost is at minimum. For this purpose, an economic order quantity should be calculated.
Economic Order Quantity (EOQ): The size of an order for which total of ordering and carrying cost are minimum.
Ordering Cost: Ordering costs are the costs which are associated with the purchase or order of materials such as cost to invite quotations, documentation works like preparation of purchase orders, employee cost directly attributable to the procurement of material, transportation and inspection cost etc.
Carrying Cost: Carrying costs are the costs for holding/ carrying of inventories in store such as the cost of fund invested in inventories, cost of storage, insurance cost, obsolescence etc.
The Economic Order Quantity (EOQ) is calculated as below:
Annual Requirement (A)- It represents demand for raw material or Input for a year.
Cost per Order (O)- It represents cost of placing an order for purchase.
Carrying Cost (C)- It represents cost of carrying average inventory on annual basis.
Assumptions underlying E.O.Q.: The calculation of economic order of material to be purchased is subject to the following assumptions:
- Ordering cost per order and carrying cost per unit per annum are known and they are fixed.
- Anticipated usage of material in units is known.
- Cost per unit of the material is constant and is known as well.
- The quantity of material ordered is received immediately i.e. the lead time is zero.
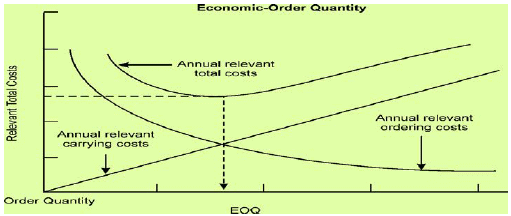
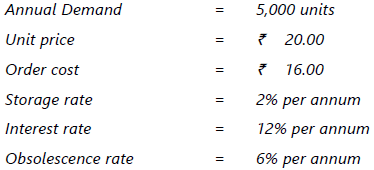
Illustration: 3
CALCULATE the Economic Order Quantity from the following information. Also state the number of orders to be placed in a year.

Illustration: 4
(i) COMPUTE E.O.Q. and the total variable cost for the following:
(ii) DETERMINE the total cost that would result for the items if a new price of ₹12.80 is used.
Total cost:
(ii) If the new price of ₹ 12.80 is used:
C = 20% of 12.80 = ₹ 2.56 per unit per annum.
Total cost:
(iii) Minimum Stock Level: It is lowest level of material stock, which must be maintained in hand at all times, so that there is no stoppage of production due to non-availability of inventory.
It is calculated as below:
Minimum Stock Level = Re-order Stock Level -(Average Consumption Rate ×Average Re-order Period)
(iv) Maximum Stock Level: It is the highest level of quantity for any material which can be held in stock at any time. Any quantity beyond this level cause extra amount of expenditure due to engagement of fund, cost of storage, obsolescence etc.
It can be calculated as below:
Maximum Stock Level = Re-order Level + Re-order Quantity -Minimum Consumption Rate × Minimum Re-order Period)
Here, Re-order Quantity may be EOQ
(iv) Maximum Stock Level: It is the highest level of quantity for any material which can be held in stock at any time. Any quantity beyond this level cause extra amount of expenditure due to engagement of fund, cost of storage, obsolescence etc.
It can be calculated as below:
Maximum Stock Level=Re-order Level + Re-order Quantity - (Minimum Consumption Rate × Minimum Re-order Period)
Here, Re-order Quantity may be EOQ
(v) Average Inventory Level: This is the quantity of material that is normally held in stock over a period. It is also known as normal stock level.
It can be calculated as below:
Average Stock Level = Minimum Stock Level + 1/2 Re-order Quantity
Alternatively, it can be calculated as below:
(vi) Danger level: It is the level at which normal issues of the raw material inventory are stopped and emergency issues are only made.
It can be calculated as below:
Danger Level = Average Consumption* × Lead time for emergency purchase
*Some time minimum consumption is also used.
(vii) Buffer Stock: Some quantity of stock may be kept for contingency to be used in case of sudden order, such stock is known as buffer stock.
All the above stock levels can be understood with the help of the following diagram: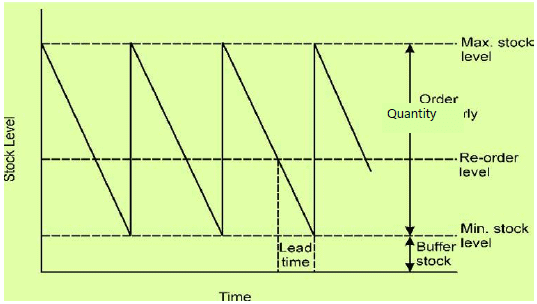 Stock Control Chart
When the materials are purchased the level keeps rising. It may reach maximum
level if the rate of issuance is less. As the materials are consumed, the stock level starts declining. At re-order level, reorder quantity is ordered and fresh supplies are normally received when stocks reach minimum level. The time interval between reorder level, when the fresh order is placed, and the time of actual receipt of materials is known as lead time.
Illustration 5
Two components, A and B are used as follows:
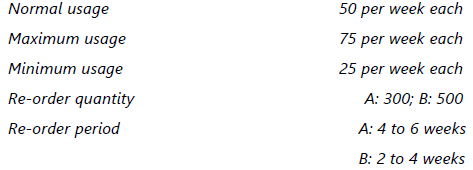
CALCULATE for each component (a) Re-ordering level, (b) Minimum level, (c) Maximum level, (d) Average stock level.
(a) Re-ordering level:
Maximum usage per week × Maximum delivery period.
Re-ordering level for component A = 75 units × 6 weeks = 450 units
Re-ordering level for component B = 75 units × 4 weeks = 300 units(b) Minimum level:
Re-order level – (Normal usage × Average period)
Minimum level for component A = 450 units – (50 units × 5 weeks) = 200 units
Minimum level for component B = 300 units – (50 units × 3 weeks) = 150 units(c) Maximum level:
Re-order level + Re-order quantity – (Min. usage × Minimum period)
Maximum level for component A = (450 units + 300 units) – (25 units × 4 weeks) = 650 units
Maximum level for component B = (300 units + 500 units) – (25 units × 2 weeks) = 750 units(d) Average stock level:
½ (Minimum + Maximum) stock level
Average stock level for component A = ½ (200 units + 650 units) =425 units.
Average stock level for component B = ½ (150 units + 750 units) =450 units.
Illustration 6
From the details given below, CALCULATE:
- Re-ordering level
- Maximum level
- Minimum level
- Danger level.
Re-ordering quantity is to be calculated on the basis of following information:
Cost of placing a purchase order is ₹ 20
Number of units to be purchased during the year is 5,000
Purchase price per unit inclusive of transportation cost is ₹ 50
Annual cost of storage per units is ₹ 5.
Details of lead time : Average- 10 days, Maximum- 15 days, Minimum- 5 days.
For emergency purchases- 4 days.
Rate of consumption : Average: 15 units per day,
Maximum: 20 units per day.
Basic Data:
A (Number of units to be purchased annually) = 5,000 units
O (Ordering cost per order) = ₹ 20
C (Annual cost of storage per unit) = ₹ 5
Purchase price per unit inclusive of transportation cost = ₹ 50.
Computations:
(i) Re-ordering level = Maximum usage per period × Maximum lead time
(ROL) = 20 units per day × 15 days = 300 units(ii) Maximum level = ROL + ROQ – [Min. rate of consumption × Min.
(Refer to working notes1 and 2) lead time]
= 300 units + 200 units – [10 units per day × 5 days]
= 450 units(iii) Minimum level = ROL – Average rate of consumption × Average re- order-period
= 300 units – (15 units per day × 10 days) =150 units(iv) Danger level = Average consumption × Lead time for emergency purchases
= 15 units per day × 4 days = 60 units
Working Notes:
- Minimum rate of consumption per day
- Re-order Quantity (ROQ) or Economic Order Quantity (EOQ) =
Inventory Stock- Out
Stock out is said to be occurred when an inventory item could not be supplied due to insufficient stock in the store. The stock- out situation costs to the entity not only in financial terms but in non-financial terms also. Due to stock out an entity not only loses overheads costs and profit but reputation (goodwill) also due to non-fulfilment of commitment. Though it may not be a monetary loss in short term but in long term it could be a reason for financial loss.
While deciding on the level of inventory, a trade-off between the stock out cost and carrying cost is made so that overall inventory cost can be minimized.
Illustration 7
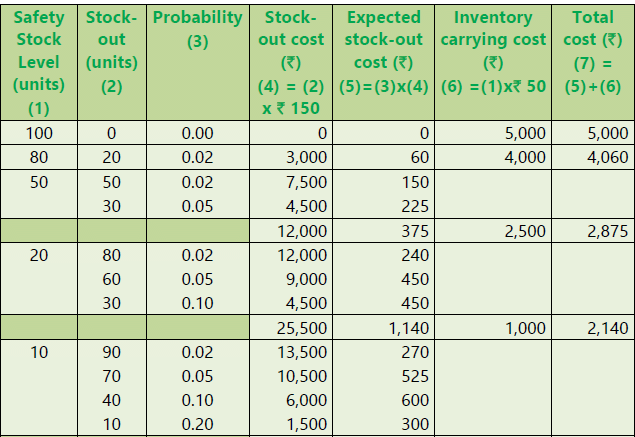
M/s Tyrotubes trades in four wheeler tyres and tubes. It stocks sufficient quantity of tyres of almost every vehicle. In year end 2019-20, the report of sales manager revealed that M/s Tyrotubes experienced stock-out of tyres.
The stock-out data is as follows:
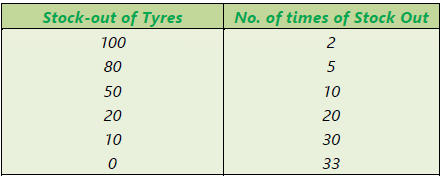
M/s Tyrotubes loses ₹ 150 per unit due to stock-out and spends ` 50 per unit on carrying of inventory.
DETERMINE optimum safest stock level.
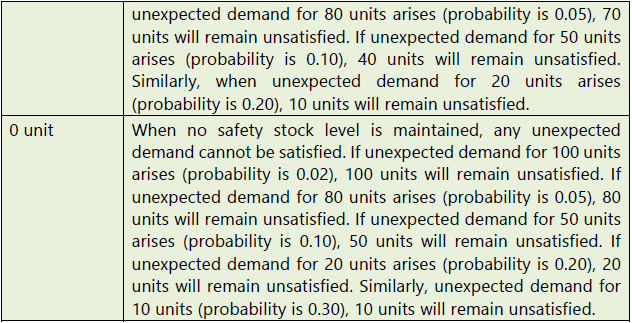
Computation of Stock-out and Inventory carrying cost
At safety stock level of 20 units, total cost is least i.e. ₹ 2,140.
Working Note:
Computation of Probability of Stock-out
Explanation:
Stock-out means the demand of an item that could not be fulfilled because of insufficient stock level.
Safety stock is the level of stock of any item which is maintained in excess of lead time consumption. It is kept as cushion against any unexpected demand for that item.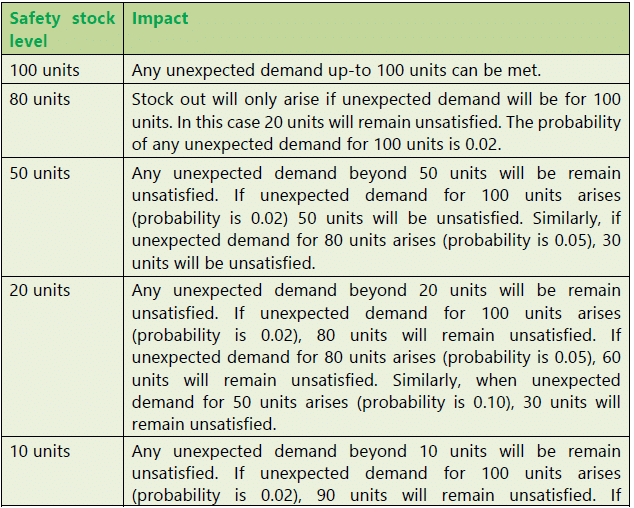
Just in Time (JIT) Inventory Management
JIT is a system of inventory management with an approach to have a zero inventories in stores. According to this approach material should only be purchased when it is actually required for production.
JIT is based on two principles
- Produce goods only when it is required and
- the products should be delivered to customers at the time only when they want.
It is also known as ‘Demand pull’ or ‘Pull through’ system of production. In this system, production process actually starts after the order for the products is received. Based on the demand, production process starts and the requirement for raw materials is sent to the purchase department for purchase. This can be understood with the help of the following diagram: Inventory Control- On the basis of Relative Classification
1. ABC Analysis: This system exercises discriminating control over different items of inventory on the basis of the investment involved. Usually the items are classified into three categories according to their relative importance, namely, their value and frequency of replenishment during a period.
- ‘A’ Category: This category of items consists of only a small percentage i.e., about 10% of the total items handled by the stores but require heavy investment about 70% of inventory value, because of their high prices or heavy requirement or both. Items under this category can be controlled effectively by using a regular system which ensures neither over-stocking nor shortage of materials for production. Such a system plans its total material requirements by making budgets. The stocks of materials are controlled by fixing certain levels like maximum level, minimum level and re-order level.
- ‘B’ Category: This category of items is relatively less important; they may be 20% of the total items of material handled by stores. The percentage of investment required is about 20% of the total investment in inventories. In the case of these items, as the sum involved is moderate, the same degree of control as applied in ‘A’ category of items is not warranted. The orders for the items, belonging to this category may be placed after reviewing their situation periodically.
- ‘C’ Category: This category of items does not require much investment; it may be about 10% of total inventory value but they are nearly 70% of the total items handled by store. For these category of items, there is no need of exercising constant control. Orders for items in this group may be placed either after six months or once in a year, after ascertaining consumption requirements. In this case the objective is to economies on ordering and handling costs.
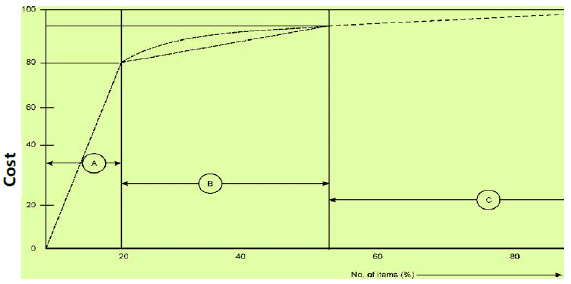
Illustration 8
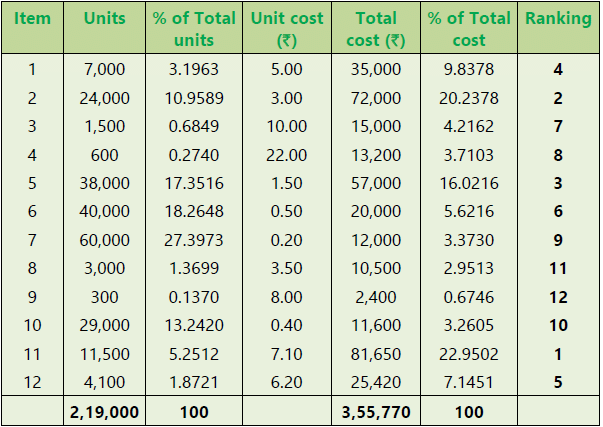
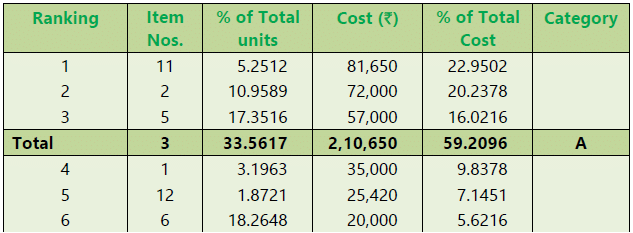
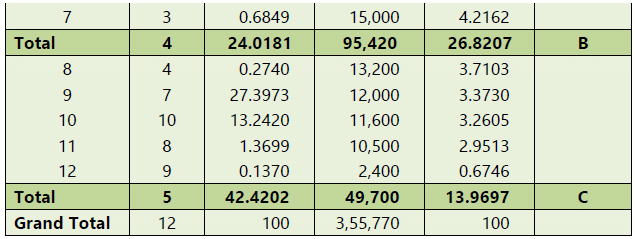
From the following details, DRAW a plan of ABC selective control: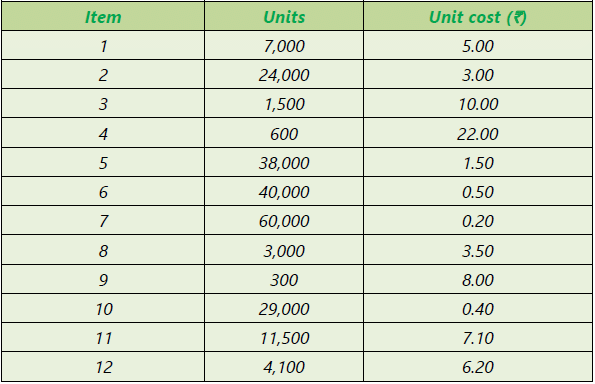
Statement of Total Cost and Ranking
Basis for selective control (Assumed)
₹ 50,000 & above -- ‘A’ items
₹ 15,000 to 50000 -- ‘B’ items
Below ₹ 15,000 -- ‘C’ items
On this basis, a plan of A B C selective control is given below:
Advantages of ABC analysis: The advantages of ABC analysis are the following:
- Continuity in production: It ensures that, without there being any danger of interruption of production for want of materials or stores, minimum investment will be made in inventories of stocks of materials or stocks to be carried.
- Lower cost: The cost of placing orders, receiving goods and maintaining stocks is minimised specially if the system is coupled with the determination of proper economic order quantities.
- Less attention required: Management time is saved since attention need to be paid only to some of the items rather than all the items, as would be the case if the ABC system was not in operation.
- Systematic working: With the introduction of the ABC system, much of the work connected with purchases can be systematized on a routine basis, to be handled by subordinate staff.
Illustration 9
A factory uses 4,000 varieties of inventory. In terms of inventory holding and inventory usage, the following information is compiled:

CLASSIFY the items of inventory as per ABC analysis with reasons.
Classification of the items of inventory as per ABC analysis
- 15 number of varieties of inventory items should be classified as ‘A’ category items because of the following reasons:
- Constitute 0.375% of total number of varieties of inventory handled by stores of factory, which is minimum as per given classification in the table.
- 50% of total use value of inventory holding (average), which is maximum, according to the given table.
- Highest in consumption, about 85% of inventory usage (in end-product).
- 110 number of varieties of inventory items should be classified as ‘B’ category items because of the following reasons:
- Constitute 2.750% of the total number of varieties of inventory items handled by stores of factory.
- Requires moderate investment of about 30% of total use value of inventory holding (average).
- Moderate in consumption, about 10% of inventory usage (in end–product).
- 3,875 number of varieties of inventory items should be classified as ‘C’ category items because of the following reasons:
- Constitute 96.875% of total varieties of inventory items handled by stores of factory.
- Requires about 20% of total use value of inventory holding (average).
- Minimum inventory consumption, i.e. about 5% of inventory usage (in end-product).
2. Fast Moving, Slow Moving and Non Moving (FSN) Inventory: It is also known as FNS (Fast, Normal and Slow moving) classification of inventory analysis.
Under this system, inventories are controlled by classifying them on the basis of frequency of usage. The classification of items into these three categories depends on the nature and managerial discretion. A threshold range on the basis of inventory turnover is decided and classified accordingly.
- Fast Moving- This category of items are placed nearer to store issue point and the stock is reviewed frequently for making of fresh orders.
- Slow Moving- This category of items are stored little far and stock is reviewed periodically for any obsolescence. and may be shifted to Non-moving category.
- Non Moving- This category of items are kept for disposal. This category of items is reported to the management and an appropriate provision for loss may be created.
Some of the reasons for slow moving and non-moving inventories are stated below:
- Failure of production management to communicate the updated requirement to the stores management
- Technological upgradation in terms of new machine requiring new kind of material or existing material becoming obsolete.
- Lack of periodic review of inventories.
By careful observation, timely identification and adoption of inventory management techniques such as maintenance of minimum level or just in time approach, one can manage slow moving and non-moving inventories. We may calculate inventory turnover ratio and present the reports of comparison of actual and standards with variations, if any to the management.
3. Vital, Essential and Desirable (VED): Under this system of inventory analysis, inventories are classified on the basis of its criticality for the production function and final product. Generally, this classification is done for spare parts which are used for production.
- Vital- Items are classified as vital when its unavailability can interrupt the production process and cause a production loss. Items under this category are strictly controlled by setting re-order level.
- Essential- Items under this category are essential but not vital. The unavailability may cause sub standardisation and loss of efficiency in production process. Items under this category are reviewed periodically and get the second priority.
- Desirable- Items under this category are optional in nature, unavailability does not cause any production or efficiency loss.
For instance, in hospital administration, stock of medicines and essential chemicals are categorized as VED or FSN inventory. In case of life saving, rare and critical drugs, they are being categorized as vital inventory. They are the ones whose unavailability can interrupt smooth service. Those inventories which are optional or substitutes, not leading to loss in efficiency would be categorized as desirable inventories. FNS categorization helps the store keepers in hospitals to keep a check on medicines whose expiry date is close and needs to be disposed off at the earliest. The quantity of slow moving drugs are maintained accordingly.
4. High Cost, Medium Cost, Low Cost (HML) Inventory: Under this system, inventory is classified on the basis of the cost of an individual item, unlike ABC analysis where inventories are classified on the basis of overall value of inventory. A range of cost is used to classify the inventory items into the three categories. High Cost inventories are given more priority for control, whereas Medium cost and Low cost items are comparatively given lesser priority.
Using Ratio Analysis
- Input- Output Ratio: Inventory control can also be exercised by the use of input- output ratio analysis. Input- output ratio is the ratio of the quantity of input of material to production and the standard material content of the actual output.
This type of ratio analysis enables comparison of actual consumption and standard consumption, thus indicating whether the usage of material is favourable or adverse. - Inventory Turnover Ratio: Computation of inventory turnover ratios for different items of material and comparison of the turnover rates provides a useful guidance for measuring inventory performance. High inventory turnover ratio indicates that the material in the question is a fast moving one. A low turnover ratio indicates over-investment and locking up of the working capital in inventories. Inventory turnover ratio may be calculated by using the following formulae: -


By comparing the number of days in the case of two different materials, it is possible to know which is fast moving and which is slow moving. On this basis, attempt should be made to reduce the amount of capital locked up, and prevent over-stocking of the slow moving items.
Illustration 10
The following data are available in respect of material X for the year ended 31st March, 2020.

CALCULATE:
(i) Inventory turnover ratio, and
(ii) The number of days for which the average inventory is held.
Inventory turnover ratio
Average number of days for which the average inventory is held
Working Note:
Illustration 11
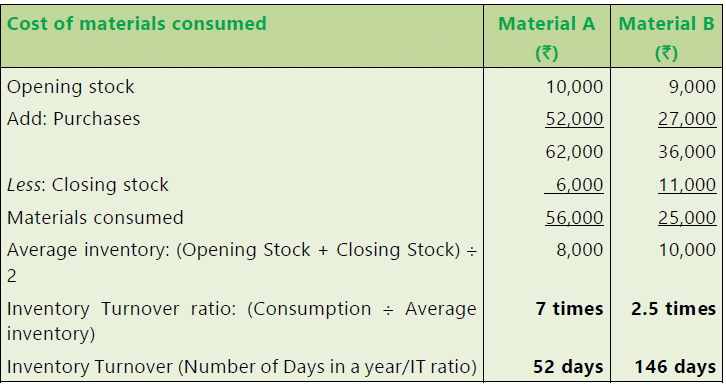
From the following data for the year ended 31st March, 2020, CALCULATE the inventory turnover ratio of the two items and put forward your comments on them.

First of all, it is necessary to find out the material consumed:
Comments: Material A is moving faster than Material B.
FAQs on Material Cost: Notes- 1 - CA Intermediate
| 1. What is material cost? |  |
| 2. How is material cost calculated? |  |
| 3. What are the factors influencing material cost? |  |
| 4. How can material cost be reduced? |  |
| 5. How does material cost impact the overall profitability of a business? |  |


