Automated Business Processes: Notes (Part - 2) | Financial Management & Strategic Management for CA Intermediate PDF Download
| Table of contents |

|
| Enterprise Risk Management (ERM) |

|
| Controls |

|
| Risks and Controls For Specific Business Processes |

|
| Diagrammatic Representation of Business Processes |

|
Enterprise Risk Management (ERM)
- In implementing controls, it is important to adapt a holistic and comprehensive approach. Hence, ideally it should consider the overall business objectives, processes, organization structure, technology deployed and the risk appetite. Based on this, overall risk management strategy has to be adapted, which should be designed and promoted by the top management and implemented at all levels of enterprise operations as required in an integrated manner. Regulations require enterprises to adapt a risk management strategy, which is appropriate for the enterprise. Hence, the type of controls implemented in information systems in an enterprise would depend on this risk management strategy. The Sarbanes Oxley Act (SOX) in the US, which focuses on the implementation and review of internal controls as relating to financial audit, highlights the importance of evaluating the risks, security and controls as related to financial statements. In an IT environment, it is important to understand whether the relevant IT controls are implemented. How controls are implemented would be dependent on the overall risk management strategy and risk appetite of the management.
- Enterprise Risk Management (ERM) may be defined as a process affected by an entity’s Board of Directors, management and other personnel, applied in strategy setting and across the enterprise, designed to identify potential events that may affect the entity, and manage risk to be within its risk appetite, to provide reasonable assurance regarding the achievement of entity objectives.
- The underlying premise of Enterprise Risk Management is that every entity, whether for profit, not-for-profit, or a governmental body, exists to provide value for its stakeholders. All entities face uncertainty, and the challenge for management is to determine how much uncertainty the entity is prepared to accept as it strives to grow stakeholder value. Uncertainty presents both risk and opportunity, with the potential to erode or enhance value. ERM provides a framework for management to effectively deal with uncertainty and associated risk and opportunity and thereby enhance its capacity to build value.
- It is important for management to ensure that the enterprise risk management strategy considers implementation of information and its associated risks while formulating IT security and controls as relevant. IT security and controls are a subset of the overall enterprise risk management strategy and encompass all aspects of activities and operations of the enterprise.
- ERM in business includes the methods and processes used by organizations to manage risks and seize opportunities related to the achievement of their objectives. ERM is a common framework applied by business management and other personnel to identify potential events that may affect the enterprise, manage the associated risks and opportunities, and provide reasonable assurance that an enterprise’s objectives will be achieved.
Benefits of Enterprise Risk Management
No entity operates in a risk-free environment and ERM does not create such an environment. Rather, it enables management to operate more effectively in environments filled with risks. ERM provides enhanced capability to do the following:
- Align risk appetite and strategy: Risk appetite is the degree of risk, on a broad-based level that an enterprise (any type of entity) is willing to accept in pursuit of its goals. Management considers the entity’s risk appetite first in evaluating strategic alternatives, then in setting objectives aligned with the selected strategy and in developing mechanisms to manage the related risks.
- Link growth, risk and return: Entities accept risk as part of value creation and preservation, and they expect return commensurate with the risk. ERM provides an enhanced ability to identify and assess risks, and establish acceptable levels of risk relative to growth and return objectives.
- Enhance risk response decisions: ERM provides the rigor to identify and select among alternative risk responses – risk avoidance, reduction, sharing and acceptance. ERM provides methodologies and techniques for making these decisions.
- Minimize operational surprises and losses: Entities have enhanced capability to identify potential events, assess risk and establish responses, thereby reducing the occurrence of surprises and related costs or losses.
- Identify and manage cross-enterprise risks: Every entity faces a myriad of risks affecting different parts of the enterprise. Management needs to not only manage individual risks, but also understand interrelated impacts.
- Provide integrated responses to multiple risks: Business processes carry many inherent risks, and ERM enables integrated solutions for managing the risks.
- Seize opportunities: Management considers potential events, rather than just risks, and by considering a full range of events, management gains an understanding of how certain events represent opportunities.
- Rationalize capital: More robust information on an entity’s total risk allows management to more effectively assess overall capital needs and improve capital allocation.
Enterprise Risk Management (ERM) Framework
ERM provides a framework for risk management which typically involves identifying events or circumstances relevant to the organization’s objectives (risks and opportunities), assessing them in terms of likelihood and magnitude of impact, determining a response strategy, and monitoring progress. Various potential threats to computer system affect the confidentiality, integrity, and availability of data and computer system. For successful continuity of business, it is very essential to evaluate these potential threats and control them so as to minimize the impact of these threats to an acceptable level. By identifying and pro-actively addressing risks and opportunities, business enterprises protect and create value for their stakeholders, including owners, employees, customers, regulators, and society overall.
ERM is a risk-based approach, which includes the methods and processes used by organizations to manage risks. ERM provides a framework for risk management which involves:
- identifying potential threats or risks.
- determining how big a threat or risk is, what could be its consequence, its impact, etc.
- implementing controls to mitigate the risks.
ERM framework consists of eight interrelated components that are derived from the way management runs a business and are integrated with the management process. These components are as follows:
(i) Internal Environment: The internal environment encompasses the tone of an organization, and sets the basis for how risk is viewed and addressed by an entity’s people, including risk management philosophy and risk appetite, integrity and ethical values, and the environment in which they operate. Management sets a philosophy regarding risk and establishes a risk appetite. The internal environment sets the foundation for how risk and control are viewed and addressed by an entity’s people. The core of any business is its people their individual attributes, including integrity, ethical values and competence – and the environment in which they operate. They are the engine that drives the entity and the foundation on which everything rests.
(ii) Objective Setting: Objectives should be set before management can identify events potentially affecting their achievement. ERM ensures that management has a process in place to set objectives and that the chosen objectives support and align with the entity’s mission/vision and are consistent with the entity’s risk appetite.
(iii) Event Identification: Potential events that might have an impact on the entity should be identified. Event identification includes identifying factors – internal and external – that influence how potential events may affect strategy implementation and achievement of objectives. It includes distinguishing between potential events that represent risks, those representing opportunities and those that may be both. Opportunities are channeled back to management’s strategy or objective-setting processes. Management identifies interrelationships between potential events and may categorize events to create and reinforce a common risk language across the entity and form a basis for considering events from a portfolio perspective.
(iv) Risk Assessment: Identified risks are analyzed to form a basis for determining how they should be managed. Risks are assessed on both an inherent and a residual basis, and the assessment considers both risk likelihood and impact. A range of possible results may be associated with a potential event, and management needs to consider them together.
(v) Risk Response: Management selects an approach or set of actions to align assessed risks with the entity’s risk tolerance and risk appetite, in the context of the strategy and objectives. Personnel identify and evaluate possible responses to risks, including avoiding, accepting, reducing and sharing risk.
(vi) Control Activities: Policies and procedures are established and executed to help ensure that the risk responses that management selected are effectively carried out.
(vii) Information and Communication: Relevant information is identified, captured and communicated in a form and time frame that enables people to carry out their responsibilities. Information is needed at all levels of an entity for identifying, assessing and responding to risk. Effective communication also should occur in a broader sense, flowing down, across and up the entity. Personnel need to receive clear communications regarding their role and responsibilities.
(viii) Monitoring: The entire ERM process should be monitored, and modifications made as necessary. In this way, the system can react dynamically, changing as conditions warrant. Monitoring is accomplished through ongoing management activities, separate evaluations of the ERM processes or a combination of both.
Controls
Control is defined as policies, procedures, practices and organization structure that are designed to provide reasonable assurance that business objectives are achieved and undesired events are prevented or detected and corrected. The main objectives of information controls are safeguarding of assets, maintenance of data integrity, effectiveness in achieving organizational objectives, and efficient consumption of resources. Controls include things like practices, policies, procedures, programs, techniques, technologies, guidelines, and organizational structures.
Example 6: Purchase to Pay-Given below is a simple example of controls for the Purchase to Pay cycle, which is broken down to four main components as shown in the Fig. 1.6.1.
- Purchases: When an employee working in a specific department (e.g., marketing, operations, sales, etc.) wants to purchase something required for carrying out the job, he/she will submit a Purchase Requisition (PR) to a manager for approval. Based on the approved PR, a Purchase Order (PO) is raised. The PO may be raised manually and then input into the computer system or raised directly by the computer system.
- Goods Receipt: The PO is then sent to the vendor, who will deliver the goods as per the specifications mentioned in the PO. When the goods are received at the warehouse, the receiving staff checks the delivery note, PO number etc. and acknowledges the receipt of the material. Quantity and quality are checked and any unfit items are rejected and sent back to the vendor. A Goods Receipt Note (GRN) is raised indicating the quantity received. The GRN may be raised manually and then input into the computer system or raised directly by computer system.
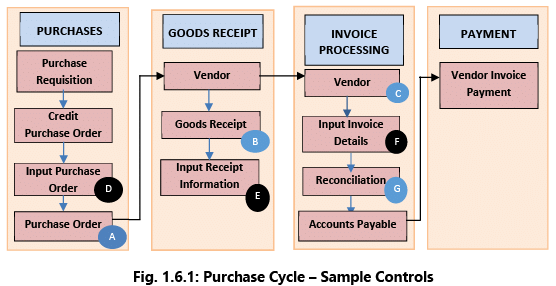
- Invoice Processing: The vendor sends the invoice to the accounts payable department who will input the details into the computer system. The vendor invoice is checked with the PO to ensure that only the goods ordered have been invoiced and at the negotiated price. Further the vendor invoice is checked with the GRN to ensure that the quantity ordered has been received.
- Payment: If there is no mismatch between the PO, GRN and vendor invoice; the payment is released to the vendor based on the credit period negotiated with the vendor.
Based on the mode of implementation, these controls can be Manual, Automated or Semi-Automated (partially manual and partially automated). The objective of a control is to mitigate the risk.
- Manual Control: Manually verify that the goods ordered in PO (A) are received (B) in good quality and the vendor invoice (C) reflects the quantity and price that are as per the PO (A).
- Automated Control: The above verification is done automatically by the computer system by comparing (D), (E) & (F) and exceptions highlighted.
- Semi-Automated Control: Verification of Goods Receipt (E) with PO (D) could be automated but the vendor invoice matching could be done manually in a reconciliation process (G).
Importance of IT Controls
IT Control objectives is defined as: “A statement of the desired result or purpose to be achieved by implementing control procedures within a particular IT activity”. Implementing right type of controls is responsibility of management. Controls provide a clear policy and good practice for directing and monitoring performance of IT to achieve enterprise objectives. IT Controls perform dual role which is as follows:
(i) They enable enterprise to achieve objectives; and
(ii) They help in mitigating risks.
Many issues drive the need for implementing IT controls. These range from the need to control costs and remain competitive to the need for compliance with internal and external governance. IT controls promote reliability and efficiency and allow the organization to adapt to changing risk environments. Any control that mitigates or detects fraud or cyber-attacks enhances the organization’s resiliency because it helps the organization uncover the risk and manage its impact. Resiliency is a result of a strong system of internal controls which enable a well-controlled organization-to manage challenges or disruptions seamlessly.
Applying IT Controls
It is important for an organization to identify controls as per policy, procedures and its structure and configure it within IT software as used in the organization.
There are different options for implementing controls as per risk management strategy. For example, the way banking is done in a nationalized bank is traditional way with rigid organization structure of managers at different levels, officers and clerks and clear demarcation between departments and functions whereas in a private sector, the organization structure is organized around customers and focused on relationship banking.
A common classification of IT controls is General Controls and Application Controls. General Controls are macro in nature and are applicable to all applications and data resources. Application Controls are controls which are specific to the application software such as payroll, accounts payable, and billing, etc.
(a) Information Technology General Controls (ITGC)
ITGC also known as Infrastructure Controls pervade across different layers of IT environment and information systems and apply to all systems, components, processes, and data for a given enterprise or systems environment. ITG controls are the basic policies and procedures that ensure that an organization’s information systems are properly safeguarded, that application programs and data are secure, and that computerized operations can be recovered in case of unexpected interruptions.
General controls include, but are not limited to:
- Information Security Policy: An Information Security policy is the statement of intent by the senior management about how to protect a company’s information assets. The security policy is a set of laws, rules, and practices that regulates how assets including sensitive information are managed, protected, and distributed within the user organization. The security policy is approved by the senior management and encompasses all areas of operations and drives access to information across the enterprise and other stakeholders.
- Administration, Access, and Authentication: Access controls are measures taken to ensure that only the authorized persons have access to the system and the actions they can take. IT should be administered with appropriate policies and procedures clearly defining the levels of access to information and authentication of users.
- Separation of key IT functions: Secure deployment of IT requires the organization to have separate IT organization structure with key demarcation of duties for different personnel within IT department and to ensure that there are no Segregation of Duties (SoD) conflicts.
- Management of Systems Acquisition and Implementation: Management should establish acquisition standards that address the security, functionality, and reliability issues related to systems acquisition. Hence, process of acquisition and implementation of systems should be properly controlled.
- Change Management: IT solutions deployed and its various components must be changed in tune with changing needs as per changes in technology environment, business processes, regulatory, compliance requirements and changing needs of the users. These changes impact the live environment of the organization. Hence, change management process should be implemented to ensure smooth transition to new environments covering all key changes including hardware, software and business processes. All changes must be properly approved by the management and tested before implementation.
- Backup, Recovery and Business Continuity: Heavy dependence on IT and criticality makes it imperative that resilience of the organization operations should be ensured by having appropriate business continuity including backup, recovery and off-site data center. Business continuity controls ensure that an organization can prevent interruptions (violations) and processing can be resumed in an acceptable period of time.
- Proper Development and Implementation of Application Software: Application software drives the business processes of the organizations. These solutions in case developed and implemented must be properly controlled by using standard software development process. Controls over software development and implementation ensure that the software is developed according to the established policies and procedures of the organization. These controls also ensure that the systems are developed within budgets, within budgeted time, security measures are duly incorporated, and quality and documentation requirements are maintained.
- Confidentiality, Integrity and Availability of Software and data files: Security is implemented to ensure Confidentiality, Integrity and Availability of information. Confidentiality refers to protection of critical information to ensure that information is only available to persons who have right to see the same. Integrity refers to ensuring that no unauthorized amendments can be made in data in all stages of processing. Availability refers to ensuring availability of information to users when required.
- Incident response and management: There may be various incidents created due to failure of IT. These incidents need to be appropriately responded and managed as per pre-defined policies and procedures.
- Monitoring of Applications and supporting Servers: The Servers and applications running on them are monitored to ensure that servers, network connections and application software along with the interfaces are working continuously.
- Value Add areas of Service Level Agreements (SLA): SLA with vendors is regularly reviewed to ensure that the services are delivered as per specified performance parameters.
- User training and qualification of Operations personnel: The personnel deployed have required competencies and skill-sets to operate and monitor the IT environment. These competencies should be consistent with the competencies required by the organization of the relevant role. Moreover, training may be used as a tool to develop the competencies and skill-sets to work in IT environment.
It is important to note that proper and consistent operation of automated controls or IT functionality often depends upon effective IT general controls. In later sections, detailed risk and control matrix for various types of general controls are provided.
(b) Application Controls
Application represents the interface between the user and the business functions.
Application Controls are controls which are implemented in an application to prevent or detect and correct errors. These controls are in-built in the application software to ensure accurate and reliable processing. These are designed to ensure completeness, accuracy, authorization and validity of data capture and transaction processing. For example: In banking, application software ensures that only transactions of the day are accepted by the system. Withdrawals are not allowed beyond limits, etc.
Some examples of Application controls are as follows-
- Data edits (editing of data is allowed only for permissible fields);
- Separation of business functions (e.g., transaction initiation versus authorization);
- Balancing of processing totals (debit and credit of all transactions are tallied);
- Transaction logging (all transactions are identified with unique id and logged);
- Error reporting (errors in processing are reported); and - Exception Reporting (all exceptions are reported).
Key indicators of effective IT controls
The IT controls implemented in an organization are considered to be effective on the basis of following criteria:
- The ability to execute and plan new work such as IT infrastructure upgrades required to support new products and services.
- Development projects that are delivered on time and within budget, resulting in cost-effective and better product and service offerings compared to competitors.
- Ability to allocate resources predictably.
- Consistent availability and reliability of information and IT services across the organization and for customers, business partners, and other external interfaces.
- Clear communication to management of key indicators of effective controls.
- The ability to protect against new vulnerabilities and threats and to recover from any disruption of IT services quickly and efficiently.
- The efficient use of a customer support center or help desk.
- Heightened security awareness on the part of the users and a security conscious culture.
Framework of Internal Control as per Standards on Auditing
A company's management team is responsible for the development of internal control policies and procedures. SA315 defines the system of Internal Control as “the process designed, implemented and maintained by those charged with governance, management and other personnel to provide reasonable assurance about the achievement of an entity’s objectives regarding reliability of financial reporting, effectiveness and efficiency of operations, safeguarding of assets, and compliance with applicable laws and regulations”.
An Internal Control System -
- facilitates the effectiveness and efficiency of operations.
- helps ensure the reliability of internal and external financial reporting.
- assists compliance with applicable laws and regulations.
- helps safeguarding the assets of the entity.
As per SA315, the five components of any internal control as they relate to a financial statement audit are explained below. All these components must be present to conclude that internal control is effective.
I. Control Environment
The Control Environment is the set of standards, processes, and structures that provide the basis for carrying out internal control across the organization. The Board of Directors and Senior Management establish the tone at the top regarding the importance of internal control, including expected standards of conduct. Management reinforces expectations at the various levels of the organization. The control environment comprises the integrity and ethical values of the organization; the parameters enabling the board of directors to carry out its governance responsibilities; the organizational structure and assignment of authority and responsibility; the process for attracting, developing, and retaining competent individuals; and the rigor around performance measures, incentives, and rewards to drive accountability for performance. The resulting control environment has a pervasive impact on the overall system of internal control.
II. Risk Assessment
Every entity faces a variety of risks from external and internal resources. Risk may be defined as the possibility that an event will occur and adversely affect the achievement of objectives. Risk Assessment involves a dynamic and iterative process for identifying and assessing risks to the achievement of objectives. Risks to the achievement of these objectives from across the entity are considered relative to established risk tolerances. Thus, Risk Assessment forms the basis for determining how risks will be managed. A precondition to risk assessment is the establishment of objectives, linked at different levels of the entity. Management specifies objectives within categories of operations, reporting, and compliance with sufficient clarity to be able to identify and assess risks to those objectives. Because economic, industry, regulatory and operating conditions will continue to change; risk assessment also requires management to consider the impact of possible changes in the external environment and within its own business model that may render internal control ineffective.
III. Control Activities
Control Activities are the actions established through policies and procedures that help ensure that management’s directives to mitigate risks to the achievement of objectives are carried out. Control activities are performed at all levels of the entity, at various stages within business processes, and over the technology environment. They may be preventive or detective in nature and may encompass a range of manual and automated activities such as authorizations and approvals, verifications, reconciliations and business performance reviews.
Broadly, the control activities include the elements that operate to ensure transactions are authorized, duties are segregated, adequate documents and records are maintained, assets and records are safeguarded, and independent checks on performance and valuation of records. Internal auditors are also concerned with administrative controls to achieve effectiveness and efficiency objectives. Control activities must be developed to manage, mitigate, and reduce the risks associated with each business process. It is unrealistic to expect to eliminate risks completely.
IV. Information and Communication
Information is necessary for the entity to carry out internal control responsibilities in support of the achievement of its objectives. Management obtains or generates and uses relevant and quality information from both internal and external sources to support the functioning of other components of internal control. Pertinent information must be identified, captured and communicated in a form and time frame that enable people to carry out their responsibilities. Communication is the continual, iterative process of providing, sharing, and obtaining necessary information. Internal communication is how information is disseminated throughout the enterprise, flowing up, down, and across the entity. It enables personnel to receive a clear message from senior management that control responsibilities should be taken seriously. External communication is two-fold: it enables inbound communication of relevant external information and provides information to external parties in response to requirements and expectations.
V. Monitoring of Controls
Monitoring controls is an ongoing, cyclical process. Ongoing evaluations, separate evaluations, or some combination of the two are used to ascertain whether each of the five components of internal control, including controls to affect the principles within each component is present and functioning. Ongoing evaluations built into business processes at different levels of the entity, provide timely information. Separate evaluations conducted periodically will vary in scope and frequency depending on assessment of risks, effectiveness of ongoing evaluations, and other management considerations. Findings are evaluated against management’s criteria and deficiencies are communicated to management and the Board of Directors as appropriate.
Limitations of Internal Control System
Internal control, no matter how effective, can provide an entity with only reasonable assurance and not absolute assurance about achieving the entity’s operational, financial reporting and compliance objectives. Internal control systems are subject to certain inherent limitations, such as:
- Management’s consideration that the cost of an internal control does not exceed the expected benefits to be derived.
- The fact that most internal controls do not tend to be directed at transactions of unusual nature. The potential for human error, such as, due to carelessness, distraction, mistakes of judgment and misunderstanding of instructions.
- The possibility of circumvention of internal controls through collusion with employees or with parties outside the entity.
- The possibility that a person responsible for exercising an internal control could abuse that responsibility, for example, a member of management overriding an internal control.
- Manipulations by management with respect to transactions or estimates and judgments required in the preparation of financial statements.
Risks and Controls For Specific Business Processes
Business Processes - Risks and Controls
Suitable controls should be implemented to meet the requirements of the control objectives. These controls can be manual, automated or semi-automated provided the risk is mitigated. Based on the scenario, the controls can be Preventive, Detective or Corrective. Preventive controls prevent risks from actualizing. Detective controls detect the risks as they arise. Corrective controls facilitate correction. In computer systems, controls should be checked at three levels, namely Configuration, Masters and Transaction level.
- Configuration
Configuration refers to the way a software system is set up. Configuration is the methodical process of defining options that are provided. When any software is installed, values for various parameters should be set up (configured) as per policies and business process work flow and business process rules of the enterprise. The various modules of the enterprise such as Purchase, Sales, Inventory, Finance, User Access etc. must be configured. Configuration will define how software will function and what menu options are displayed.
Example 7: Some examples of configuration are given below:
(i) Mapping of accounts to front end transactions like purchase and sales
(ii) Control on parameters: Creation of Customer Type, Vendor Type, year-end process
(iii) User activation and deactivation
(iv) User Access & privileges - Configuration & its management
(v) Password Management - Masters
Masters refer to the way various parameters are set up for all modules of software, like Purchase, Sales, Inventory, and Finance etc. These drive how the software will process relevant transactions. The masters are set up first time during installation and these are changed whenever the business process rules or parameters are changed. Examples are Vendor Master, Customer Master, Material Master, Accounts Master, Employee Master etc. Any changes to these data have to be authorized by appropriate personnel and these are logged and captured in exception reports. The way masters are set up will drive the way software will process transactions of that type. For example: The Customer Master will have the credit limit of the customer. When an invoice is raised, the system will check against the approved credit limit and if the amount invoiced is within the credit limit, the invoice will be created, if not the invoice will be put on “credit hold” till proper approvals are obtained.
Example 8: Some examples of masters are given here-
(i) Vendor Master: Credit period, vendor bank account details, etc.
(ii) Customer Master: Credit limit, Bill to address, Ship to address, etc.
(iii) Material Master: Material type, Material description, Unit of measure, etc.
(iv) Employee Master: Employee name, designation, salary details, etc. - Transactions
Transactions refer to the actual transactions entered through menus and functions in the application software, through which all transactions for specific modules are initiated, authorized or approved. For example: Sales transactions, Purchase transactions, Stock transfer transactions, Journal entries and Payment transactions.
Implementation or review of specific business process can be done from risk or control perspective. In case of risk perspective, we need to consider each of the key sub-processes or activities performed in a business process and look at existing and related control objectives and existing controls and the residual risks after application of controls. The residual risk should be knowingly accepted by the management.
If we review this from a control objective perspective, then for each key sub-process or activity, we will consider what is sought to be achieved by implementing controls and then evaluate whether risks are mitigated by controls which are implemented at present and what are the residual risks and whether there is need to complement/add more controls.
Given below are some examples of risks and controls for a few business processes. The checklist provided below is illustrative. It is not necessary that all the subprocesses/activities given below are applicable for all enterprises. However, they are provided to build an understanding of the sub-processes, risk and related controls and control objectives. This list can be practically used for implementation/evaluation of risk/controls of business processes detailed below. However, it should be customized specifically as per the nature of business processes and how these are implemented in the enterprise. The checklist given below is categorized into Configuration, Masters and Transactions.
Procure to Pay (P2P) – Risks and Controls
Procure to Pay (Purchase to Pay or P2P) is the process of obtaining and managing the raw materials needed for manufacturing a product or providing a service. It involves the transactional flow of data that is sent to a supplier as well as the data that surrounds the fulfillment of the actual order and payment for the product or service. Using automation, it should be possible to have a seamless procure to pay process covering the complete life-cycle from point of order to payment.
Masters
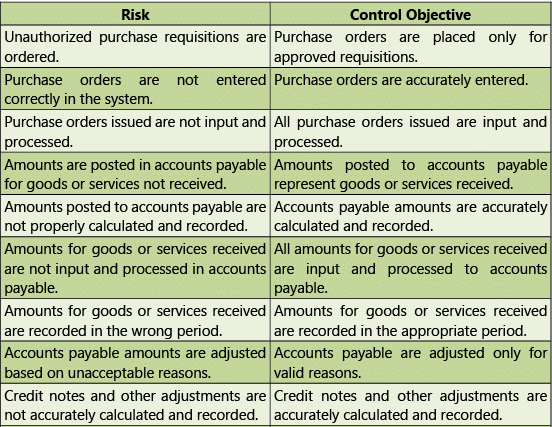
Table 1.7.1: Risks and Control Objectives (Masters-P2P)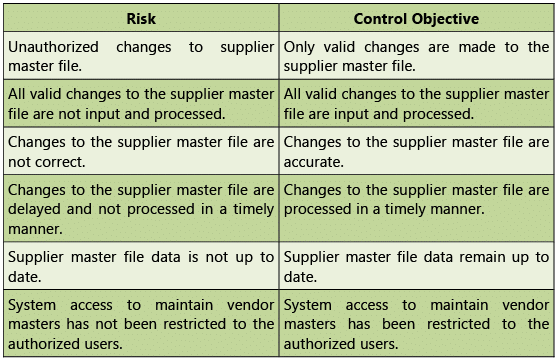
Transactions
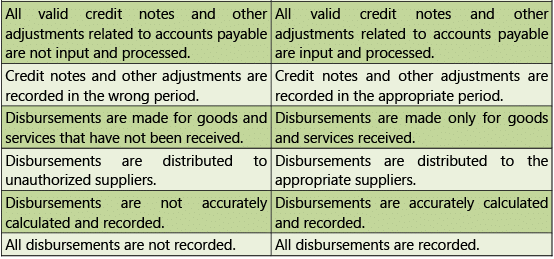
Table 1.7.2: Risks and Control Objectives (Transactions-P2P)

Order to Cash (O2C) – Risks and Controls
Order to Cash (OTC or O2C) is a set of business processes that involve receiving and fulfilling customer requests for goods or services. It is a set of business processes that involve receiving and fulfilling customer requests for goods or services. Refer Fig 1.7.1. Fig. 1.7.1 depicts an O2C cycle that consists of multiple sub-processes including:
- Customer Order: Customer order received is documented;
- Order fulfillment: Order is fulfilled or service is scheduled;
- Delivery Note: Order is shipped to customer or service is performed;
- Invoicing: Invoice is created and sent to customer;
- Collections: Customer sends payment /Collection; and
- Accounting: Payment is recorded in general ledger.
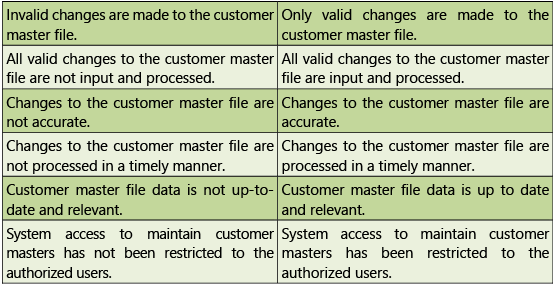
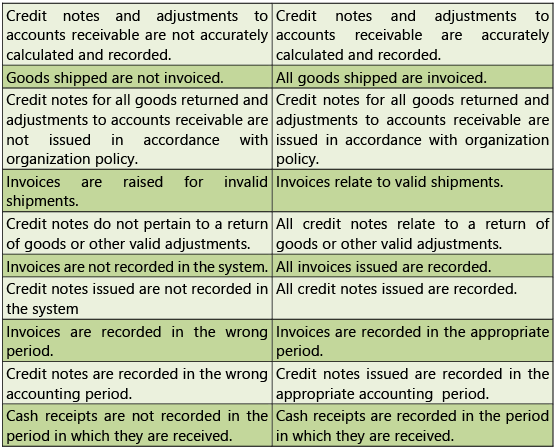
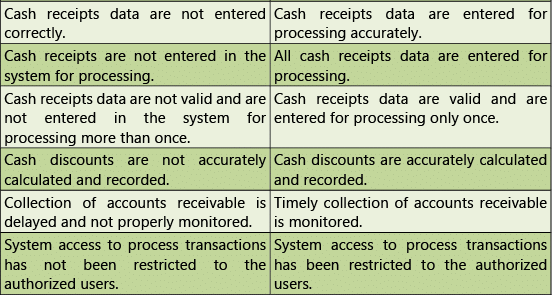
Risks and Control Objectives (Masters-O2C) and Risks and Control Objectives (Transactions-O2C) are provided below in Tables 1.7.3 and 1.7.4 respectively.
Masters
Table 1.7.3: Risks and Control Objectives (Masters-O2C)
 Transactions
Table 1.7.4: Risks and Control Objectives (Transactions-O2C)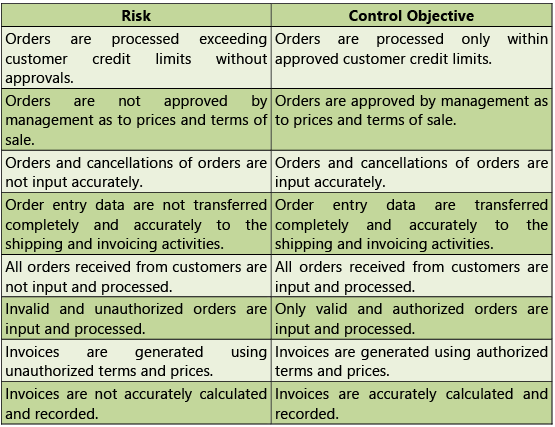
Inventory Cycle – Risks and Controls
The Inventory Cycle is a process of accurately tracking the on-hand inventory levels for an enterprise. An inventory system should maintain accurate record of all stock movements to calculate the correct balance of inventory. The term “inventory cycle” means different things to companies in different verticals. For those who source, assemble and create inventory, it refers to a time-based process which is basic to understanding how to maximize resources and cash flow. To businesses that buy, store and sell inventory, it focuses on the process of understanding, planning and managing inventory levels, from purchasing through more-efficient auditing. The typical phases of the Inventory Cycle for Manufacturers are as follows:
- The Ordering phase: The amount of time it takes to order and receive raw materials.
- The Production phase: The work in progress phase relates to time it takes to convert the raw material to finished goods ready for use by customer.
- The finished goods and delivery phase: The finished goods that remain in stock and the delivery time to the customer. The inventory cycle is measured in number of days.
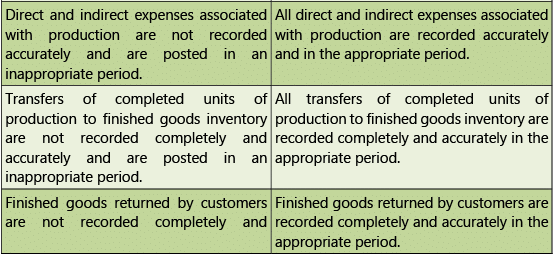
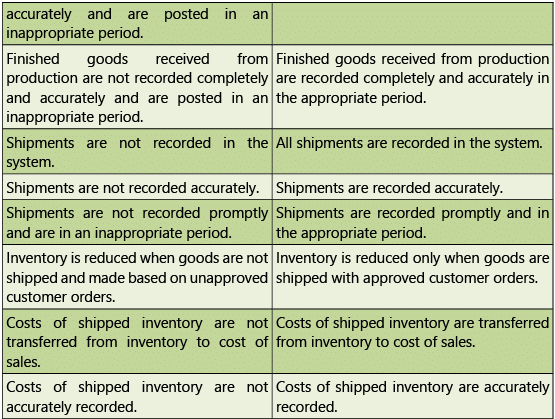
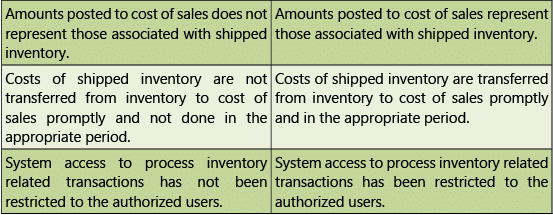
Risks and Control Objectives (Masters-Inventory) and Risks and Control Objectives (Transactions- Inventory) are provided below in Tables 1.7.5 and 1.7.6 respectively.
Masters
Table 1.7.5: Risks and Control Objectives (Masters-Inventory)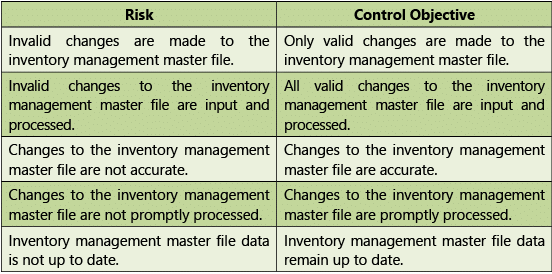
 Transactions
Table 1.7.6: Risks and Control Objectives (Transactions-Inventory)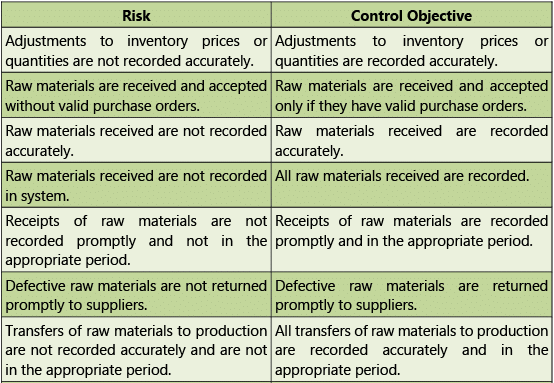
Human Resources – Risks and Controls
The Human Resources (HR) life cycle refers to human resources management and covers all the stages of an employee’s time within a specific enterprise and the role the human resources department plays at each stage. Typical stage of HR cycle includes the following:
- Recruiting and On-boarding: Recruiting is the process of hiring a new employee. The role of the human resources department in this stage is to assist in hiring. This might include placing the job ads, selecting candidates whose resumes look promising, conducting employment interviews and administering assessments such as personality profiles to choose the best applicant for the position. In a small business where the owner performs these duties personally, the HR person would assist in a support role. In some organizations, the recruiting stage is referred to as “hiring support.” On-boarding is the process of getting the successful applicant set up in the system as a new employee.
- Orientation and Career Planning: Orientation is the process by which the employee becomes a member of the company’s work force through learning his/her new job duties, establishing relationships with co-workers and supervisors and developing a niche. Career planning is the stage at which the employee and his/her supervisors work out her long-term career goals with the company. The human resources department may make additional use of personality profile testing at this stage to help the employee determine his/her best career options with the company.
- Career Development: Career development opportunities are essential to keep an employee engaged with the company over time. After an employee, has established himself/herself at the company and determined his long-term career objectives, the human resources department should try to help him/her meet his/her goals, if they are they’re realistic. This can include professional growth and training to prepare the employee for more responsible positions with the company. The company also assesses the employee’s work history and performance at this stage to determine whether he has been a successful hire.
- Termination or Transition: Some employees will leave a company through retirement after a long and successful career. Others will choose to move on to other opportunities or be laid off. Whatever the reason, all employees will eventually leave the company. The role of HR in this process is to manage the transition by ensuring that all policies and procedures are followed, carrying out an exit interview if that is company policy and removing the employee from the system. These stages can be handled internally or with the help of enterprises that provide services to manage the employee life cycle.
Risks and Control Objectives (Configuration-Human Resources) and Risks and Control Objectives (Masters-Human Resources) are provided below in Tables 1.7.7 and 1.7.8 respectively.
Configuration
Table 1.7.7: Risks and Control Objectives (Configuration-Human Resources)
 Masters
Table 1.7.8: Risks and Control Objectives (Masters-Human Resources)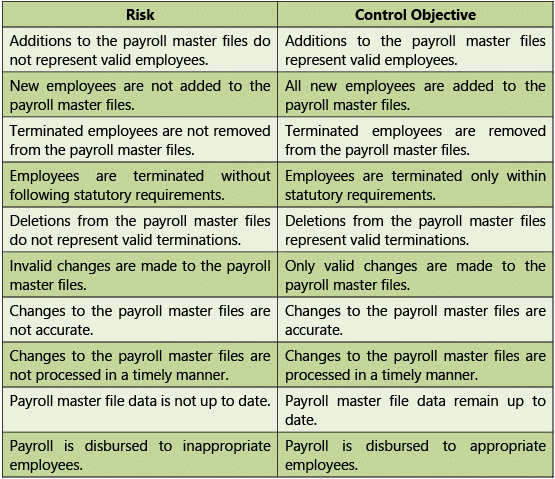

Fixed Assets – Risks and Controls Fixed Assets process ensures that all the fixed assets of the enterprise are tracked for the purposes of financial accounting, preventive maintenance, and theft deterrence. Fixed assets process ensures that all fixed assets are tracked and fixed asset record maintains details of location, quantity, condition, and maintenance and depreciation status.
Typical steps of fixed assets process are as follows:
- Procuring an asset: An asset is most often entered into the accounting system; when the invoice for the asset is entered; into the accounts payable; or purchasing module of the system.
- Registering or Adding an asset: Most of the information needed to set up the asset for depreciation is available at the time the invoice is entered. Information entered at this stage could include; acquisition date, placed-in-service date, description, asset type, cost basis, depreciable basis etc.
- Adjusting the Assets: Adjustments to existing asset information is often needed to be made. Events may occur that can change the depreciable basis of an asset. Further, there may be improvements or repairs made to asset that either adds value to the asset or extend its economic life.
- Transferring the Assets: A fixed asset may be sold or transferred to another subsidiary, reporting entity, or department within the company. These intercompany and intra-company transfers may result in changes that impact the asset’s depreciable basis, depreciation, or other asset data. This needs to be reflected accurately in the fixed assets management system.
- Depreciating the Assets: The decline in an asset’s economic and physical value is called depreciation. Depreciation is an expense which should be periodically accounted on a company’s books, and allocated to the accounting periods, to match income and expenses. Sometimes, the revaluation of an asset, may also result in appreciation of its value.
- Disposing the Assets: When a fixed asset is no longer in use, becomes obsolete, is beyond repair; the asset is typically disposed. When an asset is taken out of service, depreciation cannot be charged on it. There are multiple types of disposals, such as abandonments, sales, and trade-ins. Any difference between the book value, and realized value, is reported as a gain or loss.
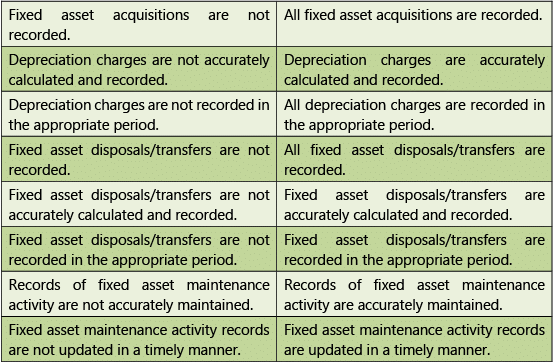
Tables 1.7.9 and 1.7.10 given below provide Risks and Control Objectives (MastersFixed Assets) and Risks and Control Objectives (Transactions-Fixed Assets) respectively.
Masters
Table 1.7.9: Risks and Control Objectives (Masters-Fixed Assets)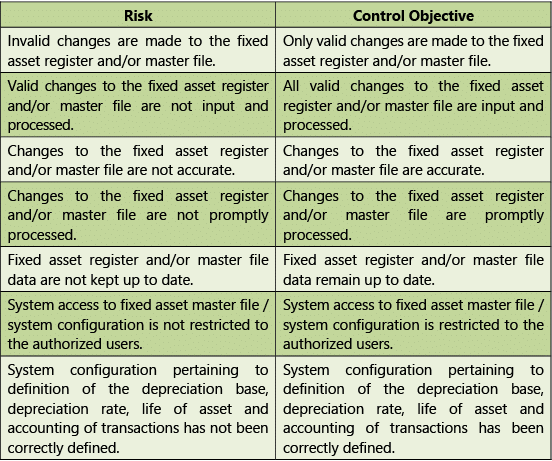 Transactions
Table 1.7.10: Risks and Control Objectives (Transactions-Fixed Assets)

General Ledger – Risks and Controls
General Ledger (GL) process refers to the process of recording the transactions in the system to finally generating the reports from financial transactions entered in the system. The input for GL Process Flow is the financial transactions and the outputs are various types of financial reports such as balance sheet, profit and loss a/c, funds flow statement, ratio analysis, etc.
The typical steps in general ledger process flow are as follows:
- Entering financial transactions into the system
- Reviewing Transactions
- Approving Transactions
- Posting of Transactions
- Generating Financial Reports
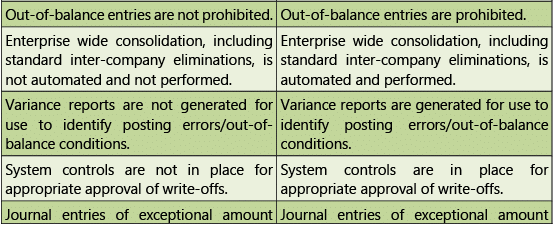
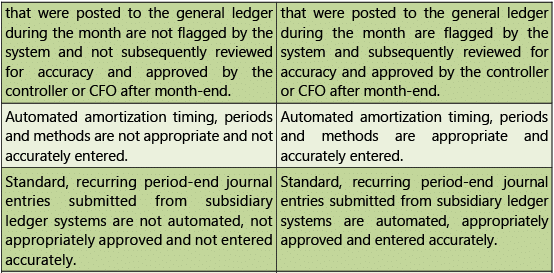
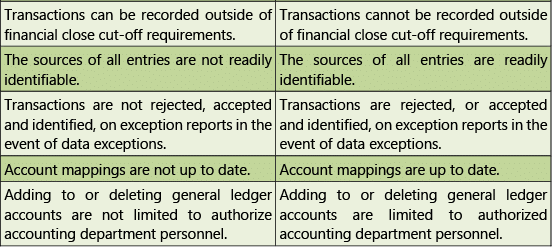
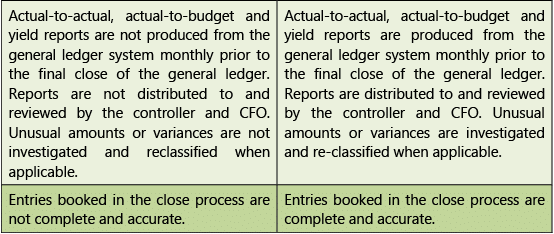
Risks and Control Objectives (Configuration-General Ledger); Risks and Control Objectives (Masters-General Ledge) and Risks and Control Objectives (TransactionsGeneral Ledger) are provided below in Tables 1.7.11, 1.7.12 and 1.7.13 respectively.
Configuration
Table 1.7.11: Risks and Control Objectives (Configuration-General Ledger)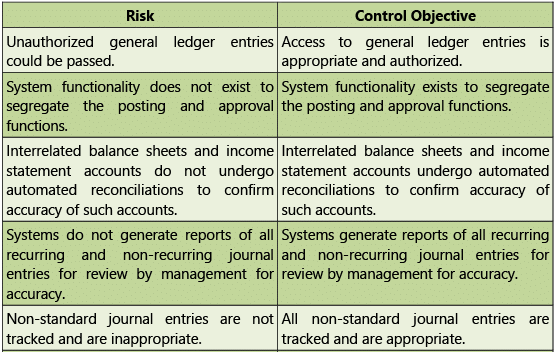
 Masters
Table 1.7.12: Risks and Control Objectives (Masters-General Ledger)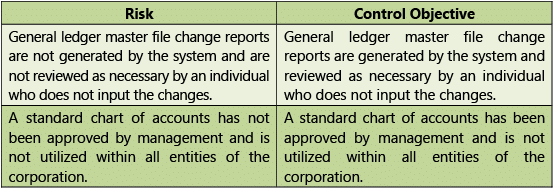 Transactions
Table 1.7.13: Risks and Control Objectives (Transactions-General Ledger)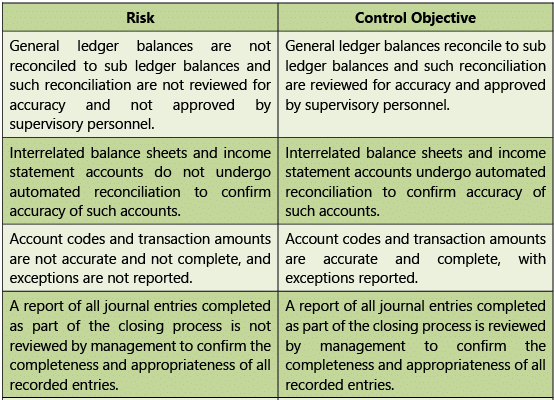
Diagrammatic Representation of Business Processes
Introduction to Flowcharts
For controlling the organization effectively, it is very important to have an understanding about its processes which can be done through business process mapping. Business process mapping refers to gathering extensive information about the current processes in an organization. This information should include description of the different activities involved in the process, the process flows, what the processes actually do, who is in charge of the process, the competence needed and how the process should be performed.
A Flowchart is a diagram that describes a process or operation. It includes multiple steps, through which the process "flows" from start to finish. Flowcharts are used in designing and documenting simple processes or programs. Like other types of diagrams, they help visualize what is going on and thereby help understand a process, and perhaps also find flaws, bottlenecks, and other less-obvious features within it.
I. Flowcharting Symbols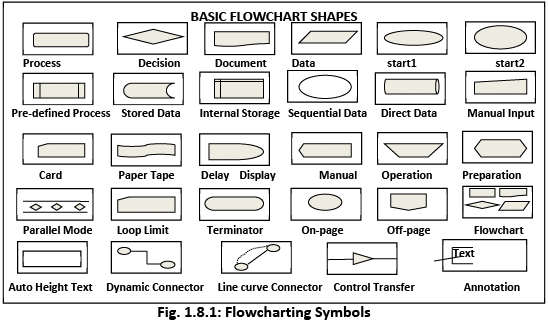 There are many different types of flowcharts, and each type has its own collection of boxes and notational conventions. The two most common types of boxes in a flowchart are as follows:
- A processing step, usually called activity and denoted as a rectangular box.
- A decision usually denoted as a diamond.
A Flowchart is described as “cross-functional” when the page is divided into different swimlanes describing the control of different organizational units. A symbol appearing in a particular “lane” is within the control of that organizational unit. This technique allows the author to locate the responsibility for performing an action or deciding correctly, showing the responsibility of each organizational unit for different parts of a single process.
II. Steps for creating flowcharts for business processes
- Identify the business process that is to be documented with a flowchart and establish the overall goal of the business process.
- Based on inputs from the business process, owner obtains a complete understanding of the process flow.
- Prepare an initial rough diagram and discuss with the business process owner to confirm your understanding of the processes.
- Obtain additional information about the business process from the people involved in each step, such as end users, stakeholders, administrative assistants and department heads. During this phase, you may find that some employees do not follow certain processes or some processes are redundant. This should be highlighted so that corrective steps can be taken by the management.
- Identify the activities in each process step and who is responsible for each activity.
- Identify the starting point of the process. The starting point of a business process should be what triggers the process to action. In other words, it is the input that the business seeks to convert into an output. Starting points generally fall into one of several categories:
(a) External events: These include the initiation of a transaction or a transmitted alert from another business system. For example, creation of a purchase order in a computer system or a sales order alerting a production system that a product should be manufactured due to lack of available stock.
(b) Content arrival: For content management systems, the starting point might be the arrival of a new document or other form of content.
(c) Human intervention: This includes customer complaints and other human intervention within or outside of the business. - Separate the different steps in the process. Identify each individual step in the process and how it is connected to the other steps. On the most general level, you will have events (steps that require no action by the business), activities (performed by the business in response to input), and decision gateways (splits in the process where the path of the process is decided by some qualifier). Between these objects, there are connectors, which can be either solid arrows (activity flow) or dashed (message/information flow).
- Business Process Modelling Notation (BPMN) is a flow-chart based notation for defining business processes. In traditional BPMN, the steps are represented by different shapes depending on their function. For example, we would use steps such as “customer order” (an event), “process order” (an activity), “Check credit” (an action), “Credit?” (A decision gateway that leads to one of two other actions, depending on a “yes” or “no” determination), and so on.
- Clarify who performs each step and what is performed in each step. To make the process as clear as possible, you should determine which part of the business completes each step. For example, different parts of the process may be completed by the accounting department, customer service, or order fulfilment. Alternately, for a small business, these steps may be completed by specific individuals. In BPMN, the associated person or department for each activity is either denoted by a designator next to the step or by a horizontal division or “lanes” in the flow chart that shows which part of the business performs each step, i.e. person or department.
Fig. 1.8.2 is a very simple flowchart which represents a process that happens in our daily life.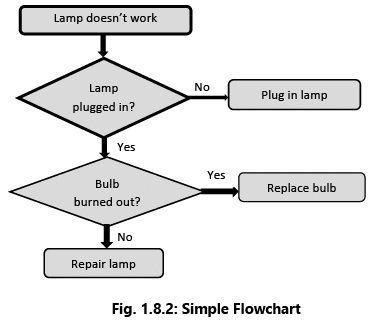
III. Advantages of Flowcharts
(a) Quicker grasp of relationships- The relationship between various elements of the application program/business process must be identified. Flowchart can help depict a lengthy procedure more easily than by describing it by means of written notes.
(b) Effective Analysis- The flowchart becomes a blue print of a system that can be broken down into detailed parts for study. Problems may be identified and new approaches may be suggested by flowcharts.
(c) Communication- Flowcharts aid in communicating the facts of a business problem to those whose skills are needed for arriving at the solution.
(d) Documentation- Flowcharts serve as a good documentation which aid greatly in future program conversions. In the event of staff changes, they serve as training function by helping new employees in understanding the existing programs.
(e) Efficient coding- Flowcharts act as a guide during the system analysis and program preparation phase. Instructions coded in a programming language may be checked against the flowchart to ensure that no steps are omitted.
(f) Program Debugging- Flowcharts serve as an important tool during program debugging. They help in detecting, locating and removing mistakes.
(g) Efficient program maintenance- The maintenance of operating programs is facilitated by flowcharts. The charts help the programmer to concentrate attention on that part of the information flow which is to be modified.
(h) Identifying Responsibilities- Specific business processes can be clearly identified to functional departments thereby establishing responsibility of the process owner.
(i) Establishing Controls- Business process conflicts and risks can be easily identified for recommending suitable controls.
IV. Limitations of Flowchart
(a) Complex logic– Flowchart becomes complex and clumsy where the problem logic is complex. The essentials of what is done can be easily lost in the technical details of how it is done.
(b) Modification– If modifications to a flowchart are required, it may require complete re-drawing.
(c) Reproduction– Reproduction of flowcharts is often a problem because the symbols used in flowcharts cannot be typed.
(d) Link between conditions and actions– Sometimes it becomes difficult to establish the linkage between various conditions and the actions to be taken there upon for a condition.
(e) Standardization– Program flowcharts, although easy to follow, are not such a natural way of expressing procedures as writing in English, nor are they easily translated into Programming language.
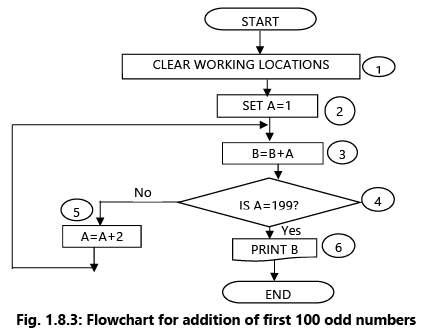
Example 9: Draw a Flowchart for finding the sum of first 100 odd numbers.
The flowchart is drawn as Fig. 1.8.3 and is explained step by step below. The step numbers are shown in the flowchart in circles and as such are not a part of the flowchart but only a referencing device.
Our purpose is to find the sum of the series 1, 3, 5, 7, 9.....(100 terms). The student can verify that the 100th term would be 199. We propose to set A = 1 and then go on incrementing it by 2 so that it holds the various terms of the series in turn. B is an accumulator in the sense that A is added to B whenever A is incremented. Thus, B will hold:
1
1 + 3 = 4
4 + 5 = 9,
9 + 7 = 16, etc. in turn.Step 1 - All working locations are set at zero. This is necessary because if they are holding some data of the previous program, that data is liable to corrupt the result of the flowchart.
Step 2 - A is set at 1 so that subsequently by incrementing it successively by 2, we get the wanted odd terms: 1,3,5,7 etc.
Step 3 - A is poured into B i.e., added to B. B being 0 at the moment and A being 1, B becomes 0 + 1 = 1.
Step 4 - Step 4 poses a question. “Has A become 199?” if not, go to step 5, we shall increment A by 2. So, that although at the moment A is 1, it will be made 3 in step 5, and so on. Then go back to Step 3 by forming loop.
Since we must stop at the 100th term which is equal to 199. Thus, A is repeatedly incremented in step 5 and added to B in step 3. In other words, B holds the cumulative sum up to the latest terms held in A.
When A has become 199 that means the necessary computations have been carried out so that in Step 6 the result is printed.
Example 10: An E-commerce site has the following cash back offers.
(i) If purchase mode is via website, an initial discount of 10% is given on bill amount.
(ii) If purchase mode is via phone app, an initial discount of 20% is given on bill amount.
(iii) If done via any other purchase mode, the customer is not eligible for any discount.
Every purchase eligible to discount is given 10 reward points.
(a) If the reward points are between 100 and 200 points, the customer is eligible for a further 30% discount on the bill amount after initial discount.
(b) If the reward points exceed 200 points, the customer is eligible for a further 40% discount on the bill amount after initial discount.
Taking purchase mode, bill amount and number of purchases as input; draw a flowchart to calculate and display the total reward points and total bill amount payable by the customer after all the discount calculation.
Let us define the variables first:
PM: Purchase Mode
BA: Bill Amount
TBA: Total Bill Amount
NOP: Number of Purchases
TRP: Total Reward Points
IN_DISC: Initial Discount
ET_DISC: Extra Discount on purchases eligible to Initial Discount
N: Counter (to track the no. of purchases)Fig. 1.8.4: Flowchart
Example 11: A bank has 500 employees. The salary paid to each employee is sum of his Basic Pay (BP), Dearness Allowance (DA) and House Rent Allowance (HRA). For computing HRA, bank has classified his employees into three classes A, B and C. The HRA for each class is computed at the rate of 30%, 20% and 10% of the BP Pay respectively. The DA is computed at a flat rate of 60% of the Basic Pay. Draw a flow chart to determine percentage of employee falling in the each of following salary slabs:
(i) Above ₹ 30,000
(ii) ₹ 15,001 to ₹ 30,000
(iii) ₹ 8,001 to ₹ 15,000
(iv) Less than or equal to ₹ 8,000
Abbreviations used in the flowchart are as follows:
P1, P2, P3 and P4: Percentage of employees falling in salary slab (salary < = 8,000); salary slab (8,001 < = salary< = 15,000); salary slab (15,001 < = salary < = 30,000) and salary slab (salary > = 30,000) respectively;
C1, C2, C3 and C4 are the number of employees falling in salary slab (salary < = 8,000); salary slab (8,001 < = salary < = 15,000); salary slab (15,001 < = salary < = 30,000) and salary slab (salary > = 30,000) respectively;I: Count of number of employees
Fig. 1.8.5: Flowchart
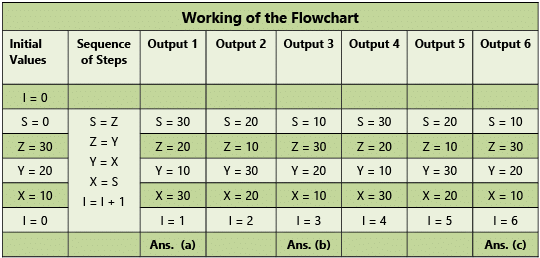
Example 12: Consider the following flowchart in the Fig. 1.8.6.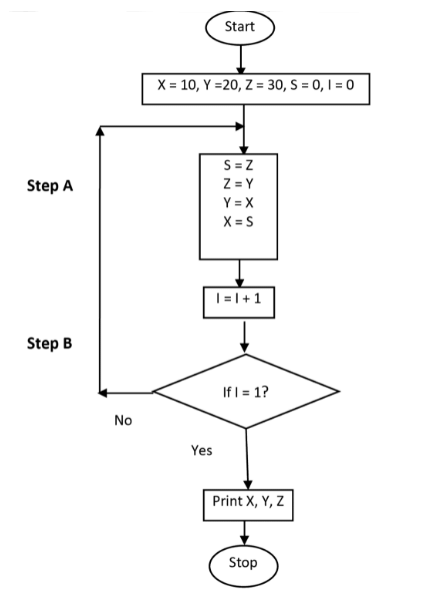 Fig. 1.8.6:(a) What is the output of the flowchart?
(b) In Step B, put I = 3 in place of I = 1; what will be the output then?
(c) In Step B, put I = 6 in place of I = 1; what will be the output then?
(d) In the given flowchart; replace I = 0 by I = 1 at Step A, what will be the output?
Refer to the Table 1.8.1.
(a) X = 30, Y = 10, Z = 20
(b) For I = 3; X = 10, Y = 20, Z = 30
(c) For I = 6; X = 10, Y = 20, Z = 30
(d) For I = 1 at Step A; the flowchart will enter an Infinite Loop as the condition I = 1 will never be true.
Table 1.8.1: Working of Example 12
Example 13: A company is selling three types of products namely A, B and C to two different types of customers viz. dealers and retailers. To promote the sales, the company is offering the following discounts. Draw a flowchart to calculate the discount for the below mentioned policy.
(i) 10% discount is allowed on product A, irrespective of the category of customers and the value of order.
(ii) On product B, 8% discount is allowed to retailers and 12% discount to dealers, irrespective of the value of order.
(iii) On product C, 15% discount is allowed to retailers irrespective of the value of order and 20% discount to dealers if the value of order is minimum of ₹ 10,000.
The required flowchart is given in Fig. 1.8.7:
Fig. 1.8.7: Flowchart
Data Flow Diagrams (DFDs)
Data Flow Diagrams – A Data Flow Diagram uses few simple symbols to illustrate the flow of data among external entities (such as people or organizations, etc.). Data Flow Diagrams (DFD) show the flow of data or information from one place to another. DFDs describe the processes showing how these processes link together through data stores and how the processes relate to the users and the outside world. The limitation of this diagram is that processes are not identified to functional departments.
Example 14: The Fig. 1.8.8 depicts a simple business process (traditional method) flow.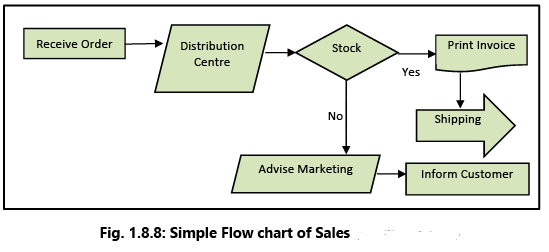
DFD basically provides an overview of:
- What data a system processes;
- What transformations are performed;
- What data are stored;
- What results are produced and where they flow.
Example 15: In the simple DFD shown in Fig. 1.8.9, please note that the processes are specifically identified to the function using “swimlanes”. Each lane represents a specific department where the business process owner can be identified. The business process owner is responsible for ensuring that adequate controls are implemented to mitigate any perceived business process risks.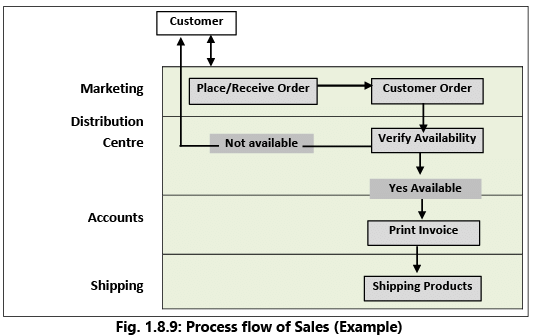 DFD is mainly used by technical staff for graphically communicating between systems analysts and programmers. Main symbols used in DFD are provided in Table 1.8.2.
Table 1.8.2: Main symbols used in DFD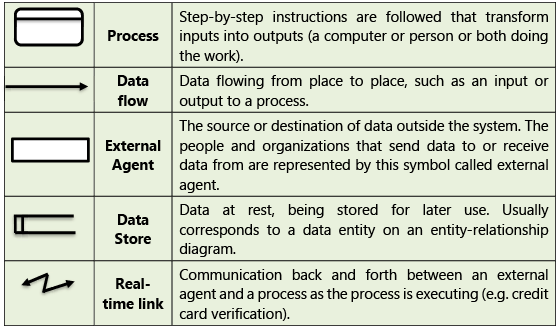
Example 16: Given below in Fig. 1.8.10 is a simple scenario depicting a book borrowed from a library being returned and the fine calculated, due to delay.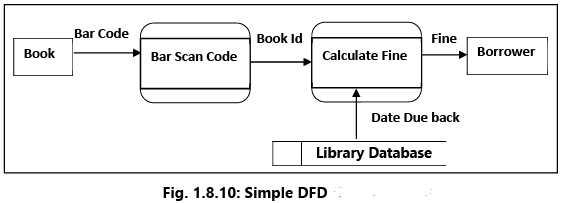
- The book is represented as an external entity and the input is the bar code.
- The process is the scanning of the bar code and giving an output of the Book ID.
- The next process calculates the fine based on accessing the “library database” and establishing the “due back” date.
- Finally, the fine is communicated to the borrower who is also shown as an external entity.
Diagrammatic Representation of Specific Business Processes
Example 17: Customer Order Fulfilment (Refer Fig. 1.8.11)
- The process starts with the customer placing an order and the sales department creating a sales order.
- The sales order goes through the Credit & Invoicing process to check credit (an activity) is it OK? (a decision gateway).
- If the customer’s credit check is not OK, you would move to the step “credit problem addressed” (an activity), followed by a decision “OK?”. If, “No” the order will be stopped.
- If the customer’s “credit check” response is “yes”, and if stock is available, an invoice is prepared, goods shipped and an invoice is sent to the customer. If the stock is not available, the order is passed to “production control” for manufacture and then shipped to customer with the invoice.
- The process ends with the payment being received from custome
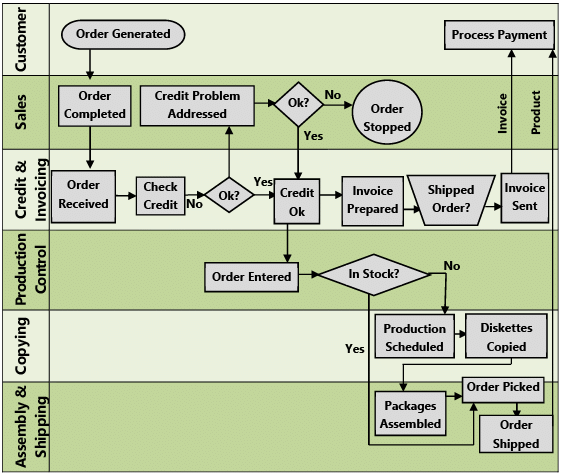 Fig. 1.8.11: Customer Order Fulfilment
Example 18: Order to Cash (Refer Fig. 1.8.12)
Fig. 1.8.12 indicates the different sub processes within the main processes in the Order to Cash cycle. It should be noted that this is only a simple example to illustrate the concept. However, in large enterprises the main processes, sub processes and activities could be much more.
(i) Sales and Marketing (SM)
- Advertises and markets the company’s products and books sales orders from customers.
(ii) Order Fulfillment
- Receives orders from SM.
- Checks inventory to establish availability of the product. If the product is available in stock, transportation is arranged and the product is sent to the customer.
(iii) Manufacturing
- If the product is not available in stock, this information is sent to the manufacturing department so that the product is manufactured and subsequently sent to the customer.
(iv) Receivables
- The invoice is created, sent to the customer, payment received and the invoice closed.
- It should be noted that under each sub process, there could be many activities. For example:
(a) Main Process – Order Fulfilment
(b) Sub Process – Receive Orders
(c) Other Activities – Check correctness and validity of information in order, enter order in computer system, check credit worthiness of customer, check credit limit, obtain approval for any discrepancy etc.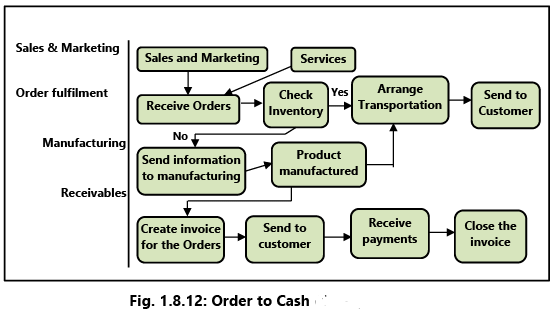
Example 19: Procure to Pay (Refer Fig. 1.8.13)
The Purchase to Pay/Procure to Pay process in Fig. 1.8.13 indicates the different processes identified specifically to department/entity through “swimlanes” so that the responsibilities are clearly defined. Let us understand flow from the perspective of each department/entity.
(i) User Department
- A user in an enterprise may require some material or service. Based on the need and justification, the user raises a Purchase Request (PR) to the Procurement department.
(ii) Procurement Department (PD)
- PD receives the PR and prioritizes the request based on the need and urgency of the user.
- It is then the responsibility of the PD to find the best source of supply, for the specific material/service. PD will then request the potential vendors to submit their quotes, based on which negotiations on price, quality and payment terms, will take place.
- The Purchase Order (PO) will then be released to the selected vendor.
(iii) Vendor
- The vendor receives the PO and carries out his own internal checks.
- Matches the PO with the quotation sent and in the event of any discrepancy will seek clarification from the enterprise.
- If there are no discrepancies, the vendor will raise an internal sales order within the enterprise.
- The material is then shipped to the address indicated in the PO.
- The Vendor Invoice (VI) is sent to the Accounts Payable department, based on the address indicated in the PO.
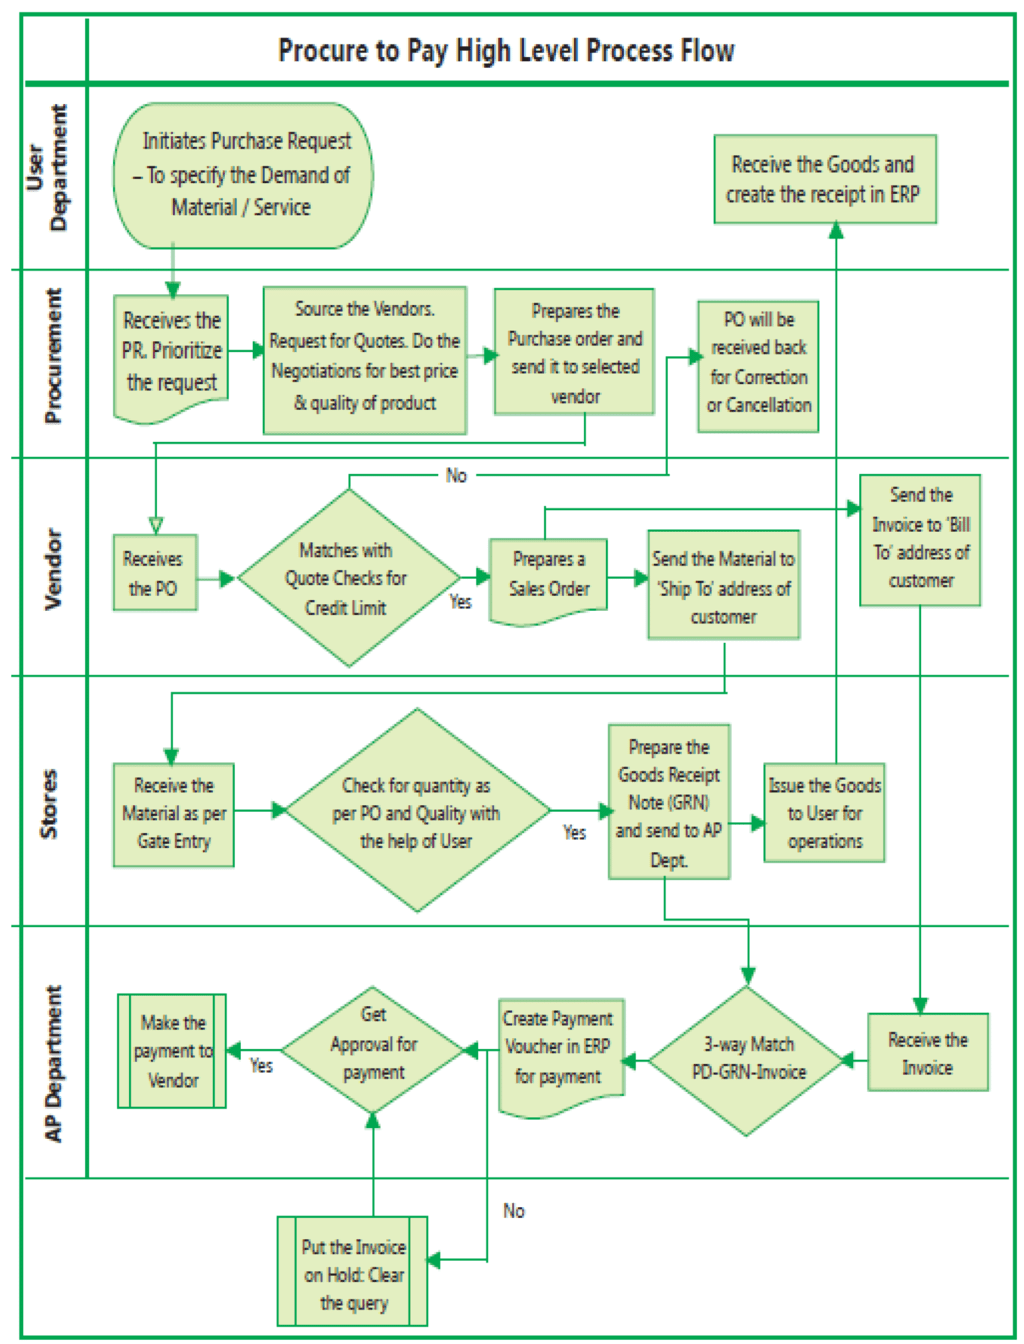 Fig. 1.8.13: Procure to Pay
(iv) Stores
- Receives the material.
- Checks the quantity received with the PO and quality with the users. If there is any discrepancy the vendor is immediately informed.
- The Goods Received Note (GRN) is prepared based on the actual receipt of material and the stores stock updated. The GRN is then sent to the Accounts Payable department for processing the payment.
- A Material Issue Note is created and the material is sent to the concerned user.
(v) Accounts Payable (AP)
AP will do a “3-way match” of PO/GRN/VI. This is to ensure that the price, quantity and terms indicated in the VI matches with the PO and the quantity received in the PO matches with the GRN quantity. This check establishes that what has been ordered has been delivered.
- If there is no discrepancy, the payment voucher is prepared for payment and the necessary approvals obtained.
- If there is a discrepancy, the VI is put “on hold” for further clarification and subsequently processed.
- Finally, the payment is made to the vendor.

