Financial & Accounting Systems: Notes (Part - 3) | Financial Management & Strategic Management for CA Intermediate PDF Download
Reporting System and Management Information Systems (MIS)
Reporting System
- A Report simply means presentation of information in proper and meaningful way. We have already discussed about system earlier. So, basically reporting system is a system of regular reporting on the pre-decided aspects.
- The basic purpose of any Financial and Accounting system is to give right information at right point of time to right people for right decision making. Two basic reports, i.e. Balance Sheet and Profit & Loss Account are used for basic analysis of financial position and financial performance. But only these two reports are not sufficient for all types of decision making. Hence, we need a proper reporting system to serve the purpose.
- Companies generally have a finance function which monitors the financial position monthly. Key reports are analysed by management to determine if appropriate financial decisions are made at the right time. For example, comparing actual revenue by region and comparing to budgets to ensure forecasts are met. These periodic reviews also ensure financial hygiene is kept and no mis-statements creep in, in the preparation of year-end financial reports.
- Companies especially the large listed corporations publish their annual reports to public at large providing many insights as to their operations, their future and their social responsibilities too. MD&A (Management Discussion & Analysis) section in these annual reports discusses how management have prepared the financial position, their interpretation of the company’s performance, the industry in which they operate and provide critical guidance on where the company is heading.
Management Information System (MIS)
An MIS report is a tool that managers use to evaluate business processes and operations. There are different kinds of MIS reports and that may be used to visually present different kinds of information.
I. What is an MIS Report?
Assume that you are the manager of a medium-sized company’s customer service department. Your staff takes phone calls and emails from over 300 customers every day. For the most part, they do a very good job, but recently, customers have started to complain that it takes too long to get their questions answered. Upper management at your company is concerned about this and wants to know what they can do to fix the problem. But before they decide, they need you to give them more information. How will you do this?
This is where MIS reports come in. Business managers at all levels of an organization, from assistant managers to executives, rely on reports generated from these systems to help them evaluate their businesses’ daily activities or problems that arise, make decisions, and track progress. MIS system reporting is used by businesses of all sizes and in every industry.
II. Who uses MIS Reports?
MIS systems automatically collect data from various areas within a business. These systems can produce daily reports that can be sent to key members throughout the organization. Most MIS systems can also generate on-demand reports. On-demand MIS reports allow managers and other users of the system to generate an MIS report whenever they need it. Many large businesses have specialized MIS departments, whose only job is to gather business information and create MIS reports. Some of these businesses use sophisticated computing technology and software to gather information. However, the method of collecting information does not have to be that complex. Smaller businesses often use simple software programs and spreadsheets for their MIS reporting needs.
There can be as many types of MIS reports as there are divisions within a business. For example, information about sales revenue and business expenses would be useful in MIS reports for finance and accounting managers. Warehouse managers would benefit from MIS reports about product inventory and shipping information. Total sales from the past year could go into an MIS report for marketing and sales managers.
III. Type of Information in a MIS Report
Example 8: In our pretend manager example, you’ve been asked to present information about your department’s customer service calls. An MIS report for this would likely contain data such as:
- The number of calls your staff takes;
- The number of emails that come in each day;
- The average amount of time it takes to answer a phone call or email; and
- The number of questions that your staff answers correctly vs. the number that are incorrect.
To make this information most useful, you also need to ensure that it meets the following criteria:
- Relevant - MIS reports need to be specific to the business area they address. This is important because a report that includes unnecessary information might be ignored.
- Timely - Managers need to know what’s happening now or in the recent past to make decisions about the future. Be careful not to include information that is old. An example of timely information for your report might be customer phone calls and emails going back 12 months from the current date.
- Accurate - It’s critical that numbers add up and that dates and times are correct. Managers and others who rely on MIS reports can’t make sound decisions with information that is wrong. Financial information is often required to be accurate to the dollar. In other cases, it may be OK to round off numbers.
- Structured - Information in an MIS report can be complicated. Making that information easy to follow helps management understand what the report is saying. Try to break long passages of information into more readable blocks or chunks and give these chunks meaningful headings.
Example 9: Let us take a case of MIS Report regarding control over cash balance. The objective of this MIS report is to have control over cash balance and accounting of cash transactions. A simple report of weekly cash report is depicted in the Table 2.7.1.
Table 2.7.1: Image of weekly cash report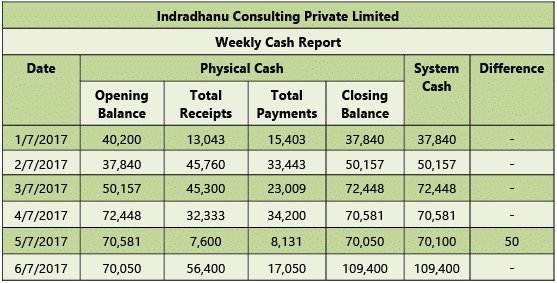

This report can be further improved by adding date wise denomination of notes as shown under in the Table 2.7.2.
Table 2.7.2: Improved version of Sales MIS Report of weekly cash
 For a sales oriented business, Sales MIS Report can be designed as under in Table 2.7.3.
Table 2.7.3: Sales MIS Report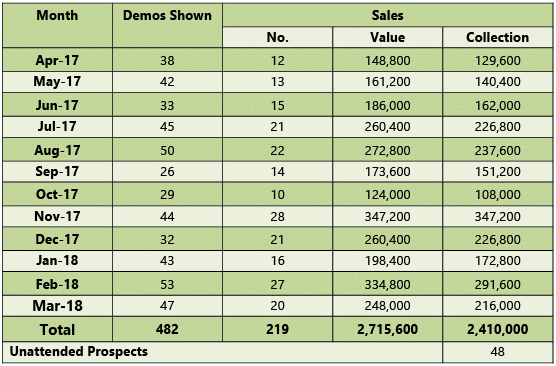
Data Analytics and Business Intelligence
Data Analytics is the process of examining data sets to draw conclusions about the information they contain, increasingly with the aid of specialized systems and software. Data analytics technologies and techniques are widely used in commercial industries to enable organizations to make more-informed business decisions and by scientists and researchers to verify or disprove scientific models, theories and hypotheses.
As a term, Data Analytics predominantly refers to an assortment of applications, from basic Business Intelligence (BI), reporting and Online Analytical Processing (OLAP) to various forms of advanced analytics. In that sense, it’s similar in nature to business analytics, another umbrella term for approaches to analysing data - with the difference that the latter is oriented to business uses, while data analytics has a broader focus. The expansive view of the term isn’t universal, though: In some cases, people use data analytics specifically to mean advanced analytics, treating Business Intelligence as a separate category.
Data Analytics initiatives can help businesses increase revenues, improve operational efficiency, optimize marketing campaigns and customer service efforts, respond more quickly to emerging market trends and gain a competitive edge over rivals -- all with the goal of boosting business performance. Depending on the particular application, the data that’s analysed can consist of either historical records or new information that has been processed for real-time analytics uses. In addition, it can come from a mix of internal systems and external data sources.
Types of Data Analytics Applications
At a high level, Data Analytics methodologies include Exploratory Data Analysis (EDA), which aims to find patterns and relationships in data, and Confirmatory Data Analysis (CDA), which applies statistical techniques to determine whether hypotheses about a data set are True or False. EDA is often compared to detective work, while CDA is akin to the work of a judge or jury during a court trial - a distinction first drawn by statistician John W. Tukey in 1977 in his book Exploratory Data Analysis. Data Analytics can also be separated into Quantitative Data Analysis and Qualitative Data Analysis.
- Quantitative Data Analysis: This involves analysis of numerical data with quantifiable variables that can be compared or measured statistically.
- Qualitative Data Analysis: The qualitative approach is more interpretive - it focuses on understanding the content of non-numerical data like text, images, audio and video, including common phrases, themes and points of view.
At the application level, Business Intelligence and reporting provides business executives and other corporate workers with actionable information about key performance indicators, business operations, customers and more. In the past, Data queries and reports typically were created for end users by BI developers working in IT or for a centralized BI team; now, organizations increasingly use self-service BI tools that let executives, business analysts and operational workers run their own ad hoc queries and build reports themselves. More advanced types of Data Analytics include–
- Data Mining, which involves sorting through large data sets to identify trends, patterns and relationships;
- Predictive Analytics, which seeks to predict customer behaviour, equipment failures and other future events; and
- Machine Learning, an artificial intelligence technique that uses automated algorithms to churn through data sets more quickly than data scientists can do via conventional analytical modelling.
Big Data Analytics applies data mining, predictive analytics and machine learning tools to sets of big data that often contain unstructured and semi-structured data. Text mining provides a means of analysing documents, emails and other text-based content. Fig. 2.8.1 showing the process of converting raw data into knowledge leading to Intelligent Decisions.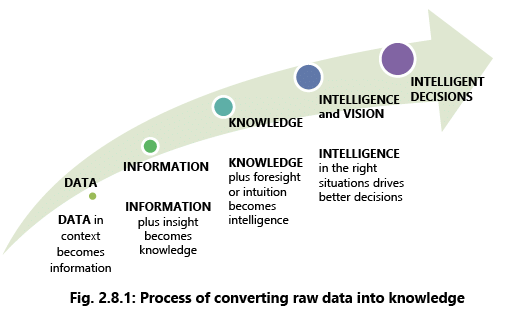 Some Application areas of Data Analytics are as follows:
- Data Analytics initiatives support a wide variety of business uses. For example, banks and credit card companies analyse withdrawal and spending patterns to prevent fraud and identity theft.
- E-commerce companies and marketing services providers do click stream analysis to identify website visitors who are more likely to buy a product or service based on navigation and page-viewing patterns.
- Mobile network operators examine customer data to forecast so they can take steps to prevent defections to business rivals; to boost customer relationship management efforts. Other companies also engage in CRM analytics to segment customers for marketing campaigns and equip call centre workers with up-to-date information about callers.
- Healthcare organizations mine patient data to evaluate the effectiveness of treatments for cancer and other diseases.
Inside the Data Analytics Process
Data Analytics applications involve more than just analysing data. Particularly on advanced analytics projects, much of the required work takes place upfront, in collecting, integrating and preparing data and then developing, testing and revising analytical models to ensure that they produce accurate results. In addition to data scientists and other data analysts, analytics teams often include data engineers, whose job is to help get data sets ready for analysis.
Data Collection: The analytics process starts with data collection, in which data scientists identify the information they need for an analytics application and then work on their own or with data engineers and IT staffers to assemble it for use. Data from different source systems may need to be combined via data integration routines transformed into a common format and loaded into an analytics system, such as a Hadoop cluster, NoSQL database or data warehouse. In other cases, the collection process may consist of pulling a relevant subset out of a stream of raw data that flows into, say, Hadoop and moving it to a separate partition in the system so it can be analysed without affecting the overall data set.
Find and Fix Data Quality Problem: Once the data that’s needed is in place, the next step is to find and fix data quality problems that could affect the accuracy of analytics applications. That includes running data profiling and data cleansing jobs to make sure that the information in a data set is consistent and that errors and duplicate entries are eliminated. Additional data preparation work is then done to manipulate and organize the data for the planned analytics use, and data governance policies are applied to ensure that the data hews to corporate standards and is being used properly.
At that point, the data analytics work begins in earnest. A data scientist builds an analytical model, using predictive modelling tools or other analytics software and programming languages such as Python, Scala, R and SQL. The model is initially run against a partial data set to test its accuracy; typically, it’s then revised and tested again, a process known as “training” the model that continues until it functions as intended. Finally, the model is run in production mode against the full data set, something that can be done once to address a specific information need or on an ongoing basis as the data is updated.
Building Analytical Model: In some cases, analytics applications can be set to automatically trigger business actions. For example, stock trades by a financial services firm. Otherwise, the last step in the data analytics process is communicating the results generated by analytical models to business executives and other end users to aid in their decision-making. That usually is done with the help of data visualization techniques, which analytics teams use to create charts and other info graphics designed to make their findings easier to understand. Data visualizations often are incorporated into BI dashboard applications that display data on a single screen and can be updated in real time as new information becomes available.
Business Intelligence (BI)
Business Intelligence (BI) is a technology-driven process for analysing data and presenting actionable information to help corporate executives, business managers and other end users make more informed business decisions. BI encompasses a wide variety of tools, applications and methodologies that enable organizations to collect data from internal systems and external sources, prepare it for analysis, develop and run queries against the data, and create reports, dashboards and data visualizations to make the analytical results available to corporate decision makers as well as operational workers.
Reasons for Business Intelligence BI
enables organizations to make well-informed business decisions and thus can be the source of competitive advantages. This is especially true when we can extrapolate information from indicators in the external environment and make accurate forecasts about future trends or economic conditions. Once business intelligence is gathered effectively and used proactively, we can make decisions that benefit our organization before the competition does.
The ultimate objective of business intelligence is to improve the timeliness and quality of information. Business intelligence reveals to us –
- The position of the firm in comparison to its competitors.
- Changes in customer behaviour and spending patterns.
- The capabilities of the firm.
- Market conditions future trends, demographic and economic information.
- The social, regulatory and political environment.
- What the other firms in the market are doing.
Example 10: Fig. 2.8.2 showing example that Business Intelligence uses data from different sources and helps to finds answers to various questions as shown on right hand side. 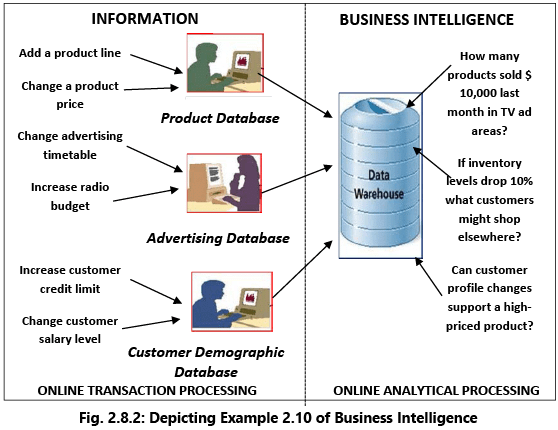 BI data can include historical information, as well as new data gathered from source systems as it is generated, enabling BI analysis to support both strategic and tactical decision-making processes. Initially, BI tools were primarily used by data analysts and other IT professionals who ran analyses and produced reports with query results for business users. Increasingly, however, business executives and workers are using BI software themselves, thanks partly to the development of self-service BI and data discovery tools.
Benefits of Business Intelligence
- BI improves the overall performance of the company using it. The potential benefits of business intelligence programs include –
(i) accelerating and improving decision making;
(ii) optimizing internal business processes;
(iii) enhancing communication among departments while coordinating activities;
(iv) increasing operational efficiency;
(v) driving new revenues; and
(vi) gaining competitive advantages over business rivals. - BI systems can also help companies identify market trends and spot business problems that need to be addressed.
- BI systems help in enhancing customer experience, allowing for the timely and appropriate response to customer problems and priorities.
Business Intelligence Technology
- Business Intelligence combines a broad set of data analysis applications, including ad hoc analysis and querying, enterprise reporting, Online Analytical Processing (OLAP), mobile BI, real-time BI, operational BI, cloud and software as a service BI, open source BI, collaborative BI and location intelligence.
- BI technology also includes data visualization software for designing charts and other info-graphics, as well as tools for building BI dashboards and performance scorecards that display visualized data on business metrics and key performance indicators in an easy-to-grasp way. BI applications can be bought separately from different vendors or as part of a unified BI platform from a single vendor.
- BI programs can also incorporate forms of advanced analytics, such as data mining, predictive analytics, text mining, statistical analysis and big data analytics. In many cases, though, advanced analytics projects are conducted and managed by separate teams of data scientists, statisticians, predictive modellers and other skilled analytics professionals, while BI teams oversee more straightforward querying and analysis of business data.
- Business Intelligence data typically is stored in a data warehouse or smaller data marts that hold subsets of a company’s information. In addition, Hadoop systems are increasingly being used within BI architectures as repositories or landing pads for BI and analytics data, especially for unstructured data, log files, sensor data and other types of big data. Before it’s used in BI applications, raw data from different source systems must be integrated, consolidated and cleansed using data integration and data quality tools to ensure that users are analysing accurate and consistent information.
- In addition to BI managers, Business Intelligence team generally include a mix of BI architects, BI developers, business analysts and data management professionals; business users often are also included to represent the business side and make sure its needs are met in the BI development process. To help with that, a growing number of organizations are replacing traditional waterfall development with Agile BI and data warehousing approaches that use Agile software development techniques to break up BI projects into small chunks and deliver new functionality to end users on an incremental and iterative basis. Doing so can enable companies to put BI features into use more quickly and to refine or modify development plans as business needs change or new requirements emerge and take priority over earlier ones.
- Business intelligence is sometimes used interchangeably with business analytics; in other cases, business analytics is used either more narrowly to refer to advanced data analytics or more broadly to include both BI and advanced analytics.
Business Reporting and Fundamentals of XBRL
Business Reporting
Business Reporting or Enterprise Reporting is the public reporting of operating and financial data by a business enterprise or the regular provision of information to decision-makers within an organization to support them in their work.
Reporting is a fundamental part of the larger movement towards improved business intelligence and knowledge management. Often implementation involves Extract, Transform, and Load (ETL) procedures in coordination with a data warehouse and then using one or more reporting tools. While reports can be distributed in print form or via email, they are typically accessed via a corporate intranet.
With the dramatic expansion of information technology, and the desire for increased competitiveness in corporations, there has been an increase in the use of computing power to produce unified reports which join different views of the enterprise in one place. This reporting process involves querying data sources with different logical models to produce a human readable report - for example; a computer user has to query the Human Resources databases and the Capital Improvements databases to show how efficiently space is being used across an entire corporation.
Organizations conduct a wide range of reporting, including financial and regulatory reporting; Environmental, Social, and Governance (ESG) reporting (or sustainability reporting); and increasingly integrated reporting.
Organizations communicate with their stakeholders about:
- mission, vision, objectives, and strategy;
- governance arrangements and risk management;
- trade-offs between the shorter- and longer-term strategies; and
- financial, social, and environmental performance (how they have fared against their objectives in practice).
Why is Business Reporting Important?
Effective and transparent business reporting allows organizations to present a cohesive explanation of their business and helps them engage with internal and external stakeholders, including customers, employees, shareholders, creditors, and regulators.
High-quality business reporting is at the heart of strong and sustainable organizations, financial markets, and economies, as this information is crucial for stakeholders to assess organizational performance and make informed decisions with respect to an organization’s capacity to create and preserve value. (Value in this context is not necessarily limited to monetary value, but can also comprise, for example, social, environmental, or wider economic value.) As organizations fully depend on their stakeholders for sustainable success, it is in their interest to provide them with high-quality reports. For example, effective high-quality reporting reduces the risk for lenders and may lower the cost of capital.
Many organizations are increasingly complex, and have larger economic, environmental, and social footprints. Thus, various stakeholder groups are demanding increased Environmental, Social and Global (ESG) information, as well as greater insight into how these factors affect financial performance and valuations.
High-quality reports also promote better internal decision-making. High-quality information is integral to the successful management of the business, and is one of the major drivers of sustainable organizational success.
Fundamentals of XBRL
XBRL (eXtensible Business Reporting Language) is a freely available and global standard for exchanging business information. XBRL allows the expression of semantic meaning commonly required in business reporting. The language is XMLbased and uses the XML syntax and related XML technologies such as XML Schema, XLink, XPath, and Namespaces. One use of XBRL is to define and exchange financial information, such as a financial statement. The XBRL Specification is developed and published by XBRL International, Inc. (XII).
I. What is XBRL?
XBRL is the open international standard for digital business reporting, managed by a global not for profit consortium, XBRL International. XBRL is used around the world, in more than 50 countries. Millions of XBRL documents are created every year, replacing older, paper-based reports with more useful, more effective and more accurate digital versions.
In a nutshell, XBRL provides a language in which reporting terms can be authoritatively defined. Those terms can then be used to uniquely represent the contents of financial statements or other kinds of compliance, performance and business reports. XBRL let’s reporting information move between organizations rapidly, accurately and digitally.
XBRL is a standards-based way to communicate and exchange business information between business systems. These communications are defined by metadata set out in taxonomies, which capture the definition of individual reporting concepts as well as the relationships between concepts and other semantic meaning. Information being communicated or exchanged is provided within an XBRL instance.
The change from paper, PDF and HTML based reports to XBRL ones is a little bit like the change from film photography to digital photography, or from paper maps to digital maps. The new format allows you to do all the things that used to be possible, but also opens up a range of new capabilities because the information is clearly defined, platform-independent, testable and digital. Just like digital maps, digital business reports, in XBRL format, simplify the way that people can use, share, analyse and add value to the data.
II. What does XBRL do?
Often termed “bar codes for reporting”, XBRL makes reporting more accurate and more efficient. It allows unique tags to be associated with reported facts, allowing:
- people publishing reports to do so with confidence that the information contained in them can be consumed and analysed accurately.
- people consuming reports to test them against a set of business and logical rules, to capture and avoid mistakes at their source.
- people using the information to do so in the way that best suits their needs, including by using different languages, alternative currencies and in their preferred style.
- people consuming the information to do so confident that the data provided to them conforms to a set of sophisticated pre-defined definitions.
III. What is XBRL tagging?
XBRL Tagging is the process by which any financial data is tagged with the most appropriate element in an accounting taxonomy (a dictionary of accounting terms) that best represents the data in addition to tags that facilitate identification/classification (such as enterprise, reporting period, reporting currency, unit of measurement etc.). Since all XBRL reports use the same taxonomy, numbers associated with the same element are comparable irrespective of how they are described by those releasing the financial statements.
Comprehensive definitions and accurate data tags allow preparation, validation, publication, exchange, consumption; and analysis of business information of all kinds. Information in reports prepared using the XBRL standard is interchangeable between different information systems in entirely different organizations. This allows for the exchange of business information across a reporting chain. People that want to report information, share information, publish performance information and allow straight through information processing all rely on XBRL.
In addition to allowing the exchange of summary business reports, like financial statements, and risk and performance reports, XBRL has the capability to allow the tagging of transactions that can themselves be aggregated into XBRL reports. These transactional capabilities allow system-independent exchange and analysis of significant quantities of supporting data and can be the key to transforming reporting supply chains.
IV. Who uses it?
The international XBRL consortium is supported by more than 600 member organizations, from both the private and public sectors. The standard has been developed and refined over more than a decade and supports almost every kind of conceivable reporting, while providing a wide range of features that enhance the quality and consistency of reports, as well as their usability. XBRL is used in many ways, for many different purposes, including by:
(i) Regulators
- Financial regulators that need significant amounts of complex performance and risk information about the institutions that they regulate.
- Securities regulators and stock exchanges that need to analyse the performance and compliance of listed companies and securities, and need to ensure that this information is available to markets to consume and analyse.
- Business registrars that need to receive and make publicly available a range of corporate data about private and public companies, including annual financial statements.
- Tax authorities that need financial statements and other compliance information from companies to process and review their corporate tax affairs.
- Statistical and monetary policy authorities that need financial performance information from many different organizations.
(ii) Companies
- Companies that need to provide information to one or more of the regulators mentioned above.
- Enterprises that need to accurately move information around within a complex group.
- Supply chains that need to exchange information to help manage risk and measure activity.
(iii) Governments
- Government agencies that are simplifying the process of businesses reporting to government and reducing red tape, by either harmonizing data definitions or consolidating reporting obligations (or both).
- Government agencies that are improving government reporting by standardizing the way that consolidated or transactional reports are prepared and used within government agencies and/or published into the public domain.
(iv) Data Providers
- Specialist data providers that use performance and risk information published into the market place and create comparisons, ratings and other value-added information products for other market participants.
(v) Analysts and Investors
- Analysts that need to understand relative risk and performance.
- Investors that need to compare potential investments and understand the underlying performance of existing investments.
(vi) Accountants
- Accountants use XBRL in support of clients reporting requirements and are often involved in the preparation of XBRL reports.
V. Important features of XBRL
- Clear Definitions: XBRL allows the creation of reusable, authoritative definitions, called taxonomies that capture the meaning contained in all the reporting terms used in a business report, as well as the relationships between all the terms. Taxonomies are developed by regulators, accounting standards setters, government agencies and other groups that need to clearly define information that needs to be reported upon. XBRL doesn’t limit what kind of information is defined: it’s a language that can be used and extended as needed.
- Testable Business Rules: XBRL allows the creation of business rules that constrain what can be reported. Business rules can be logical or mathematical, or both and can be used, for example, these business rules can be used to:
(a) stop poor quality information being sent to a regulator or third party, by being run by the preparer while the report is in draft.
(b) stop poor quality information being accepted by a regulator or third party, by being run at the point that the information is being received. Business reports that fail critical rules can be bounced back to the preparer for review and resubmission.
(c) flagging or highlighting questionable information, allowing prompt follow up, correction or explanation.
(d) create ratios, aggregations and other kinds of value-added information, based on the fundamental data provided. - Multi-lingual Support: XBRL allows concept definitions to be prepared in as many languages as necessary. Translations of definitions can also be added by third parties. This means that it’s possible to display a range of reports in a different language to the one that they were prepared in, without any additional work. The XBRL community makes extensive use of this capability as it can automatically open up reports to different communities.
- Strong Software Support: XBRL is supported by a very wide range of software from vendors large and small, allowing a very wide range of stakeholders to work with the standard.
Applicable Regulatory & Compliance Requirements
What is Regulatory Compliance?
In general, Compliance means conforming to a rule, such as a specification, policy, standard or law. Regulatory Compliance describes the goal that organizations aspire to achieve in their efforts to ensure that they are aware of and take steps to comply with relevant laws, policies, and regulations. Due to the increasing number of regulations and need for operational transparency, organizations are increasingly adopting the use of consolidated and harmonized sets of compliance controls. This approach is used to ensure that all necessary governance requirements can be met without the unnecessary duplication of effort and activity from resources.
Regulatory compliance is an organization’s adherence to laws, regulations, guidelines and specifications relevant to its business. Violations of regulatory compliance regulations often result in legal punishment, including interest, penalty, and prosecution in some cases.
By and large we can classify the compliance and regulatory requirements in two types as under.
(a) General – Applicable to all irrespective of anything.
(b) Specific – Applicable to specific type of businesses only.
Example 11: Income Tax compliance is applicable to all subject to basic exemption limit. But compliance regarding GST, Labour Law, Company Law, etc. are applicable to specific type of businesses / entities only.
Regulatory Compliance and Accounting Systems
Regulatory compliance and accounting systems are closely connected with each other. Most of the regulatory compliance requires accounting data and accounting data comes from accounting systems. E.g. Income tax returns are prepared based on accounting data only. There may be two approaches for making compliances requiring accounting data.
(a) Using same software for accounting and tax compliance; and
(b) Using different software for accounting and tax compliance.
Software is needed for tax compliances as almost all the tax compliance today is through electronic mode only. If separate software is used for accounting and tax compliance, we need to put data in tax compliance software either manually or electronically. There are some pros and cons of both the approaches as discussed in the Table 2.10.1.
Table 2.10.1: Pros and Cons of having single software for Accounting and Tax Compliance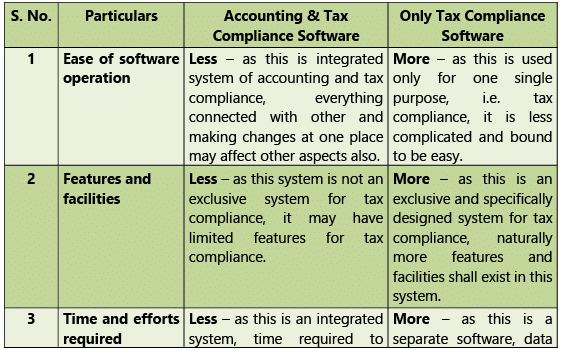
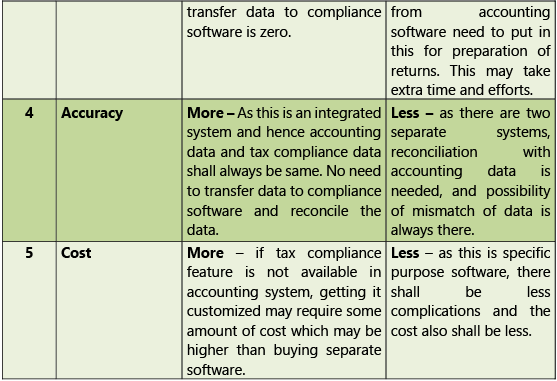
Illustration 1:
XYZ a leading publication house of Delhi was facing many issues like delay in completing the order of its customers, manual processing of data, increased lead time, inefficient business processes etc. Hence, the top management of XYZ decided to get SAP - an ERP system implemented in the publication house.
Using the proper method of vendor selection, Digisolution Pvt. Ltd. was selected to implement SAP software in XYZ publication house. To implement the software, the IT team of Digisolution Pvt. Ltd. visited XYZ’s office number of times and met its various officials to gather and understand their requirements. With due diligence, the SAP software was customized and well implemented in the publishing house.
After the SAP implementation, the overall system became integrated and well connected with other departments. This raised a concern in the mind of few employees of XYZ worrying about their jobs’ security leading to quitting of jobs.
The top management of XYZ showed its concern on this issue and wanted to retain few of its employees.
Answer the following questions:
- Imagine you are core team member of Digisolution Pvt. Ltd. While customizing the Sales and Distribution Module of SAP software, you need to know the correct sequence of all the activities involved in the module. Identify the correct option that reflects the correct sequence of the activities.
(i) Material Delivery
(ii) Billing
(iii) Pre-Sales Activities
(iv) Sales Order
(v) Payments
(vi) Inventory Sourcing
Choose the correct sequence from the following
(a) (i) - (iii) – (ii) – (iv) – (v)- (vi)
(b) (ii) – (iv)- (vi) – (iii) – (i) – (v)
(c) (iii)- (iv) – (vi)- (i) –(ii) – (v)
(d) (iv)- (i) – (iii), (v), (ii), (vi) - In purview of above situation, which of the following control can be helpful to management of XYZ ubliching house to retain its employees and stopping them to leave the company?
(a) Training can be imparted to employees by skilled consultant.
(b) Allocation of employees to task matching their skill set, fixing of compensation package.
(c) Management should stop the implementation of ERP.
(d) Backup arrangement is required. - The SAP software was successfully implemented by XYZ publication house after overcoming many challenges. The risk associated with “Patches and upgrades not installed and the tools being under-utilized” belongs to __________ risk.
(a) Technological
(b) Implementation
(c) People
(d) Process
Illustration 2:
Unique Services, a well-established firm of Chartered Accountants with nine branches at different locations in Delhi, deals in accounting, auditing and taxation assignments like – return filing, corporate taxation and planning, company formation and registration of foreign companies etc. The firm has its own ERP software. The firm decided to come up with Real Estate Regulatory Authority (RERA) registration which requires upgradation in its software. Hence, the principal partner of the firm asked its associate partner to prepare a list of various clients dealing in construction and development of flats, commercial properties etc.
The firm’s management took care to select the vendor to upgrade their ERP software which will act as an online assistant to its clients providing them the complete details about registration and filling of various forms and resolving their frequently asked questions. The firm also wanted a safe and secure working environment for their employees to filing various forms under RERA Act on behalf of clients using digital signature. The management also instructed its employees to mandatorily use Digital Signature of clients for fair practices and any dishonesty found in this regard may lead to penal provisions under various act including IT Act, 2000.
Answer the following questions:
- In purview of case scenario, Unique Services requires to make changes in its software for its users for RERA related matters. Identify the part of the overall software which actually interacts with the users using the software?
(a) Back end
(b) Front end
(c) Middle layer
(d) Reports - The firm decided to have an online assistant for its clients to provide complete details regarding taxation, registration and filling of various forms and solve their queries. This is an example of _______ application.
(a) Installed application
(b) Web Application
(c) Cloud Based Application
(d) Direct Application - While filling the tax for its client ABC, the firm Unique Services enters the detail of its TDS and GST in the requisite forms. Identify from the following which type of master data it belongs to.
(a) Accounting Master data
(b) Inventory Master Data
(c) Statutory Master data
(d) Payroll master Data
Summary
A. Integrated & Non-Integrated System
Central database is the main characteristics of an ERP system. In case of nonintegrated systems, separate database is maintained by each department separately. Central database is accessed by all the departments for their data needs and communication with other departments. Processes are defined and followed in ERP system. ERP system contains different modules for different purposes. These modules are connected to other modules as per requirements. Mismatch of master data and communication gaps between departments / business units are two major problems of non-integrated systems. Data is stored in two parts, master data and transaction data. Master data is that data which is not expected to change frequently. Voucher in manual accounting is a documentary evidence of transaction. In case of software, it also a place, input form where transaction data is input into the system. Grouping of ledgers is extremely important as reports are prepared based on grouping only. Software consists of two parts, front end and back end. Front end is used to interact with user and back end is used to store the data.
B. Business process modules and their integration with financial and accounting systems
Business process modules are developed according to need of specific industries. Various modules like Financial Accounting, Controlling, Sales and Distribution, Materials Management, Human Resources etc., are there in an ERP System. These modules are integrated with other modules depending on the nature of transaction. Financial and Accounting Systems are small and medium levels may or may not have inventory accounting.
C. Reporting System and MIS, Data Analytics and Business Intelligence
Business reporting or enterprise reporting is the public reporting of operating and financial data by a business enterprise. With the dramatic expansion of information technology, and the desire for increased competitiveness in corporations, there has been an increase in the use of computing power to produce unified reports which join different views of the enterprise in one place. High-quality reports also promote better internal decision-making.
D. Business Reporting & Fundamentals of XBRL
XBRL (eXtensible Business Reporting Language) is a freely available and global standard for exchanging business information. XBRL is used by Government, Companies, Regulators, Data Providers, Accountants, Analysts and Investors also.
E. Applicable regulatory and compliance requirements
Compliance means conforming to a rule, such as a specification, policy, standard or law. Regulatory compliance is an organization’s adherence to laws, regulations, guidelines and specifications relevant to its business. Violations of regulatory compliance regulations often result in legal punishment, including interest, penalty and prosecution in some cases. There may be two types of compliances, General and Specific.
What you've learned?
Understand about working of Financial and Accounting System.
- Grasp the knowledge about Integrated and Non-Integrated Systems.
- Comprehend about business process modules.
- Acknowledge about Reporting Systems, Data Analytics, Business Intelligence and Fundamentals of XBRL.
- Comprehend about regulatory and compliance requirements and their correlation with financial and accounting systems.


