Class 12 Economics: CBSE Sample Question Papers- Term II (2021-22)- 1 | Sample Papers for Class 12 Commerce PDF Download
Class-XII
Time: 120
Max. Marks: 40
General instructions:
- This is a Subjective Question Paper containing 13 questions.
- This paper contains 5 questions of 2 marks each, 5 questions of 3 marks each and 3 questions of 5 marks each.
- 2 marks questions are Short Answer Type Questions and are to be answered in 30-50 words.
- 3 marks questions are Short Answer Type Questions and are to be answered in 50-80 words.
- 5 marks questions are Long Answer Type Questions and are to be answered in 80-120 words.
- This question paper contains Case/Source Based Questions.
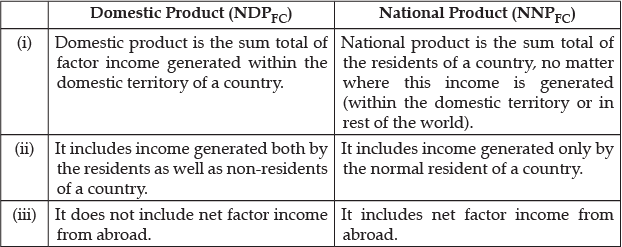
Q.1. Distinguish between Domestic product and National product.
OR
What is the difference between factor income and transfer income?
The difference between Domestic Product and National Product are:
OR
The difference between Factors Income and Transfer Income.
Q.2. In an economy, income generated is four times the increase in investment expenditure. Calculate the value of MPC and MPS.
OR
In an economy, the marginal propensity to consume is 0.9. If the investment increase by 1000 crores. Calculate the total increase in income.
Given,
Multiplier = 4 {As increase in income (ΔY) is 4 times the increase in investment (ΔI)}
Multiplier (K) = (1/(1 −MPC))
4 = 1/(1 −MPC)
1 – MPC = 1/4
So, MPC = 0.75
MPS = 1 – MPC
MPS = 1 – 0.75
MPS = 0.25
Thus, MPC = 0.75 and MPS = 0.25
OR
Multiplier (K) = 1/(1 −MPC)
K = 1/(1 - 0.9)
K = 1/(0.10)
K = 10
We know that,
K = (Change in Income/Change in Investment) = (ΔY/Δl)
Given, Change in Investment = 1,000 crores
Thus, (10 = Change in Income (ΔY)/1,000)
ΔY = 5 × 1,000 = 10,000 crores
So, Change in Income (ΔY) = 5,000 crores
{Total increase in Income = 10,000 crores}.
Q.3. ‘The Central Bank reduces the bank rate to increase the money supply in the economy ’. Justify the given statement.
The rate at which the Central Bank lens money to commercial banks termed as bank rate. In case of deficient demand, the Central Bank reduces the bank rate to increase the money supply in the economy.
Reduction in bank rate increases the credit/money creation capacity of commercial banks and also reduces the market rate of interest which encourages people to borrow more. In this way, the Aggregate Demand increases to the level of Aggregate Supply and the economy attains equilibrium.
Q.4. Discuss the main drawbacks of our health care system.
OR
Compare and analyze the ‘Distribution of Workforce by Industrial category, 2011-2012’ in rural and urban areas on the basis of the following information:
Distribution of Workforce by Industry, 2011-2012
Public health system and facilities are not sufficient for the bulk of the population. The hospitals which are run by the government do not provide sufficient facilities, only one fifth hospital of total hospitals are located in rural areas, villagers have no access to any specialised care like paediatric, gynaecology, anaesthesia and obstetrics.
OR
(i) Primary sector is the main source of employment for majority of workers in India. Secondary sector provides employment to only about 24 per cent of workforce. About 27 per cent of workers are in the service sector.
(ii) About 67 per cent of the workforce in rural India depends on agriculture, forestry and fishing. About 16 per cent of rural workers are working in manufacturing industries, construction and other industrial activities.
(iii) Service sector provides employment to only about 17 per cent of rural workers. Agriculture is not a major source of employment in urban areas where people are mainly engaged in the service sector.
(iv) About 60 per cent of urban workers are in the service sector. The secondary sector gives employment to about 30 per cent of urban workforce.
Q.5. “It would not be an exaggeration to call infrastructure a Social Overhead Cost”.
Give your opinion in support of this statement.
Good infrastructure raises productivity and lowers production cost. It should not only develop rapidly rather its development should precede the development of other sectors. There is a direct and proportional relation between infrastructure and production. As a result of one percent increase in infrastructure there is one percent increase in production. That’s why infrastructure is also known as Social Overhead Cost.
Q.6. Giving valid reasons explain which of the following will not be included in estimation of National Income of India?
(i) Contribution to Social Security Schemes paid by employee.
(ii) Death duties, Gift tax & Wealth tax.
(iii) Income from Illegal activities.
OR
Calculate the value added by Industry C on the basis of following data:
(a) Sale by Firm A to B = ₹ 50,000
(b) Value added by Firm B = ₹ 10,000
(c) Value added by Firm D = ₹ 9,000
(d) Sale by Firm C to D = ₹ 70,000
(e) Final sale = ₹ 1,00,000
(i) No, it should not be included in national income because these have already been included in factor income.
(ii) No, these are not included in national income, because these are paid out of past income or services.
(iii) Income from black marketing, robbery, corruption, etc., is not included in national income because no services are provided for such incomes.
OR
Given,
Value added by Firm A = ₹ 50,000
Value added by Firm B = ₹ 10,000
Value added by Firm D = ₹ 9,000
Final sale = ₹ 1,00,000
Thus,
Total Value added by all the sector = Final sale = 1,00,000
Let the value added by Firm C = x
Then,
Final sale = Value added by Firm A + Value added by Firm B + Value added by Firm C + Value added by Firm D.
1,00,000 = 50,000 + 10,000 + x + 9,000
1,00,000 = 69,000 + x
x = 1,00,000 – 69,000 = 31,000
Value added by Industry C is ₹ 31,000.
Q.7. Analyse the given data of India’s Health infrastructure and highlight the important point from the given information.
Read the following hypothetical case study and answer the questions 8 and 9 that follows on the basis of the same:
If we look at the global population, out of every six persons living in this world, one is an Indian and another a Chinese. We shall compare some demographic indicators of India, China and Pakistan. The population of Pakistan is very small and accounts for roughly about one-tenth of China or India. Though China is the largest nation and geographically occupies the largest area among the three nations, its density is the lowest.
In the late 1950s and 1960s, Pakistan introduced a variety of regulated policy framework (for import substitution-based industrialisation).The policy combined tariff protection for manufacturing of consumer goods together with direct import controls on competing imports. The introduction of Green Revolution led to mechanisation and increase in public investment in infrastructure in select areas, which finally led to a rise in the production of food grains. This changed the agrarian structure dramatically. In the 1970s, nationalisation of capital goods industries took place. Pakistan then shifted its policy orientation in the late 1970s and 1980s when the major thrust areas were denationalisation and encouragement of private sector. During this period, Pakistan also received financial support from western nations and remittances continuously increasing outflow of emigrants to the Middle-east. This helped the country in stimulating economic growth. The then governmental so offered incentives to the private sector. All this created a conducive climate for new investments. In 1988, reforms were initiated in the country.
China is moving ahead of India and Pakistan. This is true for many indicators —income indicator such as GDP per capita, or proportion of population below poverty line or health indicators such as mortality rates, access to sanitation, literacy, life expectancy or malnourishment. China and Pakistan are ahead of India in reducing proportion of people below the poverty line and also their performance insanitation. But India and Pakistan have not been able to save women from maternal mortality. In China, for one lakh births, only 29 women die whereas in India and Pakistan, about 133 and 140 women die respectively. Surprisingly all the three countries report providing improved drinking water sources for most of its population. China has the smallest share of poor among the three countries. Find out for yourself how these differences occur.
The given data shows that improvement in the health statues of the population has been the priority of the country. Our national policy, too, aims at improving the accessibility of health care, family welfare and nutritional services with a special focus on the under – privileged segment of population. Since 2010, there has been a significant expansion in the Allopathy health services and Nursing Personnel:
- Allopathic Doctors increased from 33,301 in 2010 to 15,976 in 2014
- Nursing personnel increased from 17,02,555 in 2010 to 26,21,981 in 2014.
Q.8. What are the similarities between Indian and Chinese economy?
China and India are two of the fastest growing countries in the world, because they both have become epicentres of world economy due to their unprecedented economic growth. More than half of Asia’s GDP is shared by India and China. In 1987, GDP (Nominal) of both countries was almost equal but in 2019, China’s GDP is 4.61 times greater than India. In terms of per capita GDP, both countries remained the same. In 90s, India’s per capita income was competitive with China.
Q.9. How do you characterize Chinese economy today?
China is the second largest country in the world, which contributes 27.18 percent to the total GDP of the total global wealth in nominal and PPP terms, respectively. In the year 2019, the GDP of China was 4.77 times more than that of India. The contribution of the service sector to the economy of China is more than that of the agriculture and manufacturing sector. The character of China’s economy is that, it is progressing very fast. In 1987, China’s economy was weak in comparison to India but at present it is a nation generating almost four and half times the income of India.
Q.10. Explain the limitation of Per Capita Real GDP as Indicator of economic welfare.
It has been found in many economies that despite of a faster growth in GDP, there are many such problems still exist in those countries. This reflects the fact that Real Per Capita GDP has certain limitations as a good indicator of economic welfare. These are:
- The growth in GDP does not reflect the statistic about the distribution of income.
- The consumption of good and services is not reflected in the growth of GDP.
- Non – Monetary transactions like services of housewives are not estimated in GDP.
- The Externalities are not taken into account while estimating GDP.
Q.11. “An excess of aggregate demand over aggregate supply always implies a situation of inflationary gap”. Do you agree with this statement? Justify your answer.
No, I do not agree with the given statements as the statements is false.
Aggregate demand and aggregate supply create an inflationary gap but have certain condition. Inflationary gap is the situation when the aggregate demand is more than the aggregate supply at the level of full employment, before that level it will not lead to the situation of inflationary gap.
Inflationary gap generates extra pressure on the existing flow of goods and services at the level of full employment. Accordingly, prices tend to rise. The output will not increase. To correct the situation of Inflationary Gap, Repo Rate is increased. As a follow-up action, Commercial Banks raise the market rate of interest (the rate at which the Commercial Banks lends money to the consumers and the investors). This reduces demand for credit. Consequently, consumption expenditure and investment expenditure get reduced. Implying a reduction in Aggregate Demand, as required to correct Inflationary Gap.
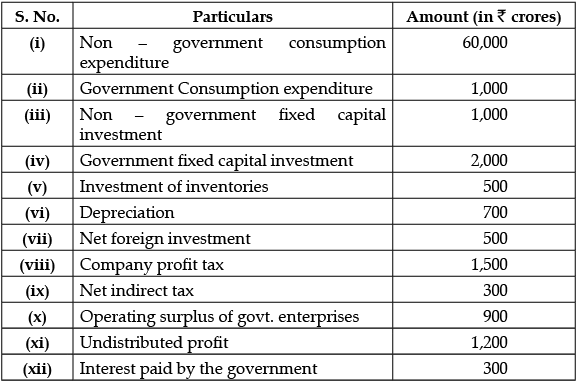
Q.12. (a) Use expenditure method to calculate Net National Product.
(b) ‘‘Circular flow of income is very important.’’ Explain.
OR
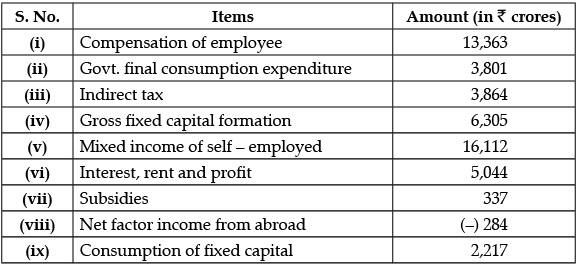
(a) Calculate (i) Gross Domestic product at Market Price (ii) Gross National Product at Market Price by Income Method.
(b) Government raises its expenditure on producing public goods. Which economic value does it reflect? Explain
(a) Net National Product (Expenditure Method)
NNP = (i) + (ii) + (iii) + (iv) + (v) + (vii) – (vi)
= 60,000 + 1000 + 1000 + 2000 + 500 + 500 – 700
= ₹ 64,300 crores
(b) Circular flow of income is important due to the following reasons:
(i) Knowledge of Interdependence: Circular flow model helps to understand interdependence between different sectors of the economy. For example, it tells the interdependence between producers and households.
(ii) Level of Economic Activity: Circular flow, through its information on various macro variable, tells us about the level of economic activities in an economy.
OR
(a) (i) Gross Domestic product at Market Price by Income Method:
GDPMP = Compensation of employee + Mixed income of self-employed + Interest rent and profit + compensation of fixed capital + Indirect Tax + Subsidies
GDPMP = (i) + (v) + (vi) + (ix) + (iii) – (vii)
GDPMP = 13,363 + 16,112 + 5,044 + 2,217 + 3,864 – 337
GDPMP = ₹ 40,263 crores
(ii) Gross National Product at Market Price by Income Method:
GNPMP = GDPMP + Net factor income from abroad
GNPMP = GDPMP + (viii)
= 40,263 + (–) 284
= ₹ 39,979 crores
(b) If government raises its expenditure on producing public goods, it reflects that government is serving the objective of social welfare. Public goods are those goods which satisfy collective consumption needs, i.e., health, education, fresh air, civic amenities, etc. When government raises its expenditure on public goods, residents of a country are benefited by being provided with these basic amenities. Healthy and educated people are more efficient which can lead to increase in GDP in future too.
Thus, it will improve the overall quality of life of the people in the country.
Q.13. (i) “Urban People have a variety of employment”. In the light of the above statement discuss the distribution of employment by region.
(ii) There are some urgent environmental problems faced by India currently.” Justify the statement.
(i) Distribution of employed workers by region enables us to know the quality of employment and the attachment of workers to their jobs:
- Self-Employed : It is major source of livelihood in both urban areas (43%) and rural areas (56%) . But, in case of rural areas, self-employed workers are greater as majority of rural people.
- Casual Workers: In case of rural areas, casual workers account for second major source of employment with 35% of work force.
- Regular Salaries Employee: In urban areas, it is the second major source with 42% of work force. Urban people have a variety of employment opportunity because of their educational attainments and skills. In urban areas, the nature of work is different and enterprises require workers on a regular basis. However, only 9% of rural people are engaged as regular salaried employee due to illiteracy and lack of skills.
(ii) India is currently facing some urgent environmental problems. They are:
- Land degradation: Land in India suffers from varying degrees and types of degradation stemming, mainly from unsuitable use and inappropriate management practices.
- Bio-diversity loss: In India, the per capita forest land is only 0.08 hectare against the requirement of 0.47 hectare to meet basic needs, resulting in an excess falling of about 15 million cubic meters forests over the permissible limits.
- Management of fresh water: In our country management of fresh water is altogether faulty. Unplanned urbanisation, loss of rain water (as it seeps into the earth), faulty systems of waste disposal are responsible for polluted water.
- Air Pollution: Air pollution is very dangerous for plants, animals and human beings. It is a serious concern mainly in urban areas where the dust and smoke are emitted by factories.
|
130 docs|5 tests
|


