Sphere of Urban Influence | Geography Optional for UPSC PDF Download
Introduction
Urban centers have a strong connection with the surrounding landscape, as they both influence and are influenced by the socio-economic and cultural aspects of the area. This connection extends to a radial distance from the city's physical boundaries, where the city imports goods and services, as well as receives labor resources and economic inputs. This area, which has functional and economic integration with the city, is known as the sphere of urban influence. The concept was first introduced by Northam and later supported by Canter.
- The urban sphere of influence is also referred to as "Umland" by geographers from Scandinavia and Germany. "Umland" is a German word that means "the area around." This term was first used by the Allies during World War II.
- The largest possible sphere of influence is called the city region, where the widest range of goods and services is provided. This term was first introduced by Dickinson and is used to describe a similar situation on a much larger scale. For ports, analogous regions are referred to as hinterlands.
- In essence, the sphere of influence can be defined as the city's catchment area, where it both draws in and provides various services and products. The terms city region, urban sphere of influence, and Umland all have the same meaning, and their boundaries are based on the range of goods and services provided, as well as the demand and supply.
- Every urban center, regardless of population size or function, has a region of influence. The intensity of this influence decreases as the distance from the city's core increases. Generally, larger populations lead to a greater variety of functions and, as a result, a larger influence zone. The influence area of a city may also expand due to improved communication networks.
- The size of a city's influence area is proportional to the number and volume of services it provides. For example, Mumbai has a larger sphere of influence than Lucknow because it offers more extensive services. The range of goods and services refers to the maximum distance a person would reasonably travel to obtain goods and services from a city. For instance, someone living in Chennai may purchase an iPhone locally, but they would need to travel to Delhi for the Supreme Court.
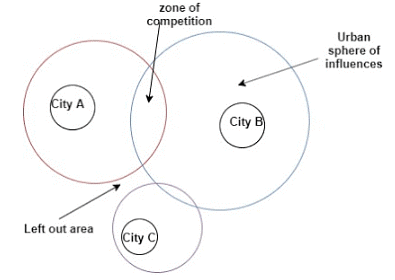
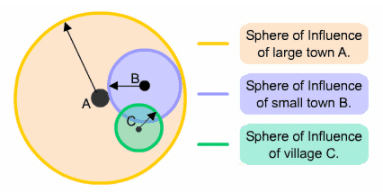
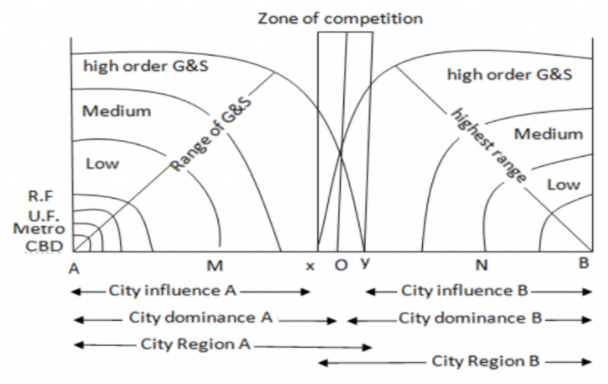
- City influence refers to the specific area where a city holds exclusive control and monopoly over its goods and services, typically involving lower and medium-level offerings. This influence is determined by the intensity and magnitude of the city's functions, which follow the distance decay law.
- The structure of an urban sphere of influence is based on the centrality of goods and services and their characteristic range. In this context, range refers to distance, while centrality refers to demand.
- City dominance is a concept that describes a region where a city competes with other cities, but its own economic functions remain dominant. This dominance is due to the city's ability to provide more goods and services to the region than its competitors.
- The zone of competition is an area where two or more cities overlap in terms of providing goods and services. This overlapping area creates a boundary that defines the extent of each city's sphere of influence. The cities involved in this competition will have their boundaries located within this zone.
- A city region refers to the most extensive area of a city's sphere of influence. In a given diagram, for example, AY and BX could represent the city regions for cities A and B, respectively. Meanwhile, AM and BN represent the exclusive regions for each city, where no competition occurs.
In summary, city influence is a concept that helps to define the area where a city holds exclusive control over its goods and services. Factors such as distance decay law, centrality, and range play a role in determining the structure and extent of a city's sphere of influence. City dominance, the zone of competition, and city region are essential concepts to understand when studying city influence and its implications for urban planning and development.
Determination of Urban Sphere of Influence
The urban sphere of influence can be determined by two methods
- Qualitative methods
- Quantitative methods
Qualitative methods: This method is based on empirical observation of primary and secondary data. Primary data is collected data from field surveys and secondary data is collected from agencies and organisations.
UN Criteria
- For 5000 population town (5000-10000)
- Service provided by primary health centres
- Primary and secondary education
- Post office accounts and services
- Cycle repair
- Bank account holders
- Repairing and purchase of agricultural equipments
- Purchase of cloths
- For 1 lakh plus cities
- Purchase of agricultural equipments. E.g. tractors, machines
- Higher education
- Treatment of lethal disease
- Purchase of costly clothing and ornaments for special occasions.
R L Singh criteria
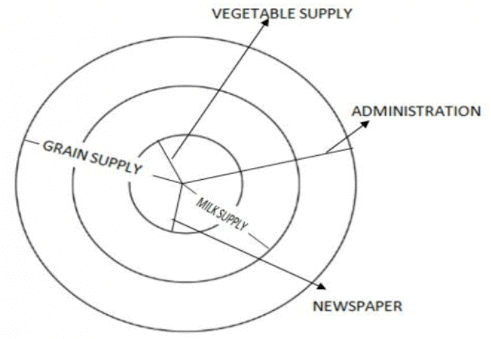
He was first to study the Umland of any city of India (Varanasi in 1956). He classified two sets of criteria for Varanasi
1. Demand based (inflow variables)
- Vegetable supply (he concluded 8 km distance for Varanasi)
- Milk supply
- Grain supply
2. Supply based (outflow variables)
- Bus service
- Newspaper distribution
- Administration
He took out the radial distance for each of the goods and services from the centre of city. The R L Singh’s study was followed by the study of U Singh, who studied Allahabad (1961) and later KAVAL (Kanpur, Allahabad, Varanasi, Agra, Lucknow) towns (1962).
Quantitative methods
- Quantitative methods are further classified into geometrical and statistical method
- Geometrical methods: It is also divided into two methods viz. Skyline Method and Proximal Method
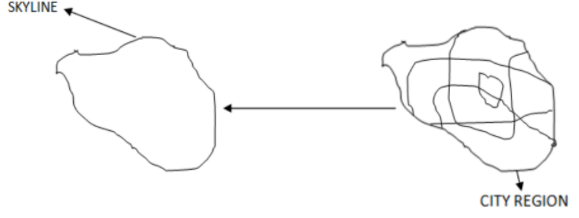
(i) Skyline Method- The Skyline Method is an approach used to determine the range of goods and services within an urban area. It involves collecting and analyzing data from surveys to establish the boundaries of different goods and services up to their supply points. These boundaries are then represented as irregular polygons.
- To find the urban sphere of influence, these polygons are layered on top of each other, with their outermost overlapping boundaries forming the limit. This method helps to effectively map and understand the distribution of various goods and services within a city or urban area.
(ii) Proximal Method
- The Proximal Method, also known as the Thiessen Polygon method, is a technique used to map urban centers within the same hierarchy. In this method, urban centers are plotted on a map and the midpoints between these cities are connected using straight lines.
- This results in the formation of an irregular polygon that covers the entire surface, representing the boundaries of each city's sphere of influence or region. This approach allows for a visual representation of the city regions and their respective areas of influence.

Statistical Model
Statistical models are often used to quantify various aspects of urban fields, city regions, or urban spheres of influence. One common approach is to use Gravity Analogue Models, which are based on Newton's law of gravity. Other models rely on probability, while some are constructed based on behavioral matrix analysis, where primary data is collected to understand individuals' choices, demands, and preferences.
- One example of a Gravity Analogue Model is the Breakpoint Theory. In this model, let's consider two cities separated by a distance of 18 km, with populations of 45,000 and 5,000, respectively. The population is treated as mass, and the law of gravitation is applied to estimate the gravitational pull exerted by each city on the surrounding area.
- By using these types of models, researchers can gain insights into the relationships between cities and their surrounding regions, as well as better understand the factors that influence urban growth and development.

- Gravity = Pi*Pj/dij
- This has been further modified to get the break point (point between i and j where pull of i will be effective) between i and j.
- Break Point = dij/√1+ (Pi/Pj)
- In above case the break point for city I will be 4.5 km from J
- The break point law provides linear boundary. Based on this method, the break point for each of surrounding cities are found and connected with straight line.
Law of Retail Trade Gravitation (Gravity Analogue Model)
- This law was proposed by Reilly. It assumes that there is settlement K with population size 1000 located at the distance of 12 km from city I and 6 km from city J.
- The following formula gives the ratio of the volume of trade moving into either city I or J. It can also express the number of people travelling to respective cities for goods and services.
(i) Mki/Mkj = Pi/Pj*(dkj/dki)² = 40000/5000*(6/12)² = 2:1 - In above equation
(i) Mki= Mass of people/ volume of trade moving from k to i
(ii) Pi= Population of i
(iii) dik= Distance between i and k. - In above case we get the ratio of 2:1 which signifies that if two people move from k to i, 1 moves to j.

- This method provides a well defined cut off area of influence. It is hence widely appreciated and is used in developed countries. However, this model is far from reality and hence less applicable.
Probability model by Haff
- This model is based on the law of probability to determine how many people/the volume of trade will move to cities I and J.
- If settlement k is located on the midpoint and the population size is the same, then the ratio will be 50:50.
- If the ratio of distance is 18:6 with the same population then the ratio will be 1:9.
- Similarly, various probabilities can be worked out.
For a city region, linear boundaries can never be drawn. City region can be defined by centrality and range of goods and services which is variable for each of them. This model failed because human behavior is unpredictable.
Behavioural model
- The behavioral model, which focuses on individual analysis at a specific point in time, can become quite complex, making it difficult to accurately determine the boundaries of a city region. This is due to several factors, including inconsistencies in primary data, changes in people's decision-making over time and circumstances, and the inability to quantify people's choices, tastes, emotions, and values. Moreover, human behavior cannot be fully explained through rigid models or laws.
- One attempt to quantify people's behavior was made by Prat, who created a behavioral model matrix. However, this approach still faced challenges in precisely determining a city's sphere of influence. In many developing countries, cities' influence areas can be star-shaped, which requires modifications to the statistically demarcated area based on empirical methods or the inclusion of variables that can better represent the functional influence area.
- A more effective approach would be to combine statistical and empirical methods, as seen in the case of the National Capital Region (NCR) in India. By using this combined approach, the demarcated area extends along important roadways outside of Delhi, better reflecting the city's influence. In contrast, developed Western countries have more evenly distributed infrastructure and less settlement growth along roadsides due to environmental concerns.
- It is important to recognize that city regions are largely mental constructs or abstract notions, and accurately delimiting them using quantitative methods is challenging due to the dynamic nature of demand, production, and population size in city centers. Instead, qualitative methods can be used to provide a more accurate representation of a city's sphere of influence.
Conclusion
In conclusion, understanding the urban sphere of influence and its various aspects is crucial for urban planning and development. While quantitative methods, such as geometrical and statistical models, can provide some insights, they often fall short of accurately representing the dynamic nature of city regions. Instead, qualitative methods that consider factors such as distance decay law, centrality, and range can offer a more comprehensive understanding of a city's sphere of influence. By combining both statistical and empirical approaches, urban planners can effectively analyze city influence areas and develop strategies that optimize the use of resources and foster sustainable growth in urban centers.Frequently Asked Questions (FAQs) of Sphere of Urban Influence
What is the urban sphere of influence?
The urban sphere of influence refers to the area surrounding a city that is functionally and economically integrated with the city, where it both draws in and provides various services and products. This area is influenced by the city's socio-economic and cultural aspects and is determined by the range of goods and services provided, as well as the demand and supply.
What are the factors that determine the structure and extent of a city's sphere of influence?
Factors such as distance decay law, centrality, and range play a role in determining the structure and extent of a city's sphere of influence. City dominance, the zone of competition, and city region are essential concepts to understand when studying city influence and its implications for urban planning and development.
What are the methods used to determine the urban sphere of influence?
The urban sphere of influence can be determined using qualitative and quantitative methods. Qualitative methods involve empirical observation of primary and secondary data, while quantitative methods include geometrical and statistical techniques, such as Skyline Method, Proximal Method, Gravity Analogue Models, and behavioral models.
What are the limitations of using statistical models to determine a city's sphere of influence?
Statistical models can be limited by several factors, including inconsistencies in primary data, changes in people's decision-making over time and circumstances, and the inability to quantify people's choices, tastes, emotions, and values. Human behavior cannot be fully explained through rigid models or laws, making it challenging to accurately determine the boundaries of a city region using statistical models alone.
How can a more accurate representation of a city's sphere of influence be achieved?
A more accurate representation of a city's sphere of influence can be achieved by combining statistical and empirical methods, as seen in the case of the National Capital Region (NCR) in India. This approach allows for a better reflection of the city's influence, especially when considering the dynamic nature of demand, production, and population size in city centers.
|
303 videos|636 docs|252 tests
|
FAQs on Sphere of Urban Influence - Geography Optional for UPSC
| 1. What is the Sphere of Urban Influence? |  |
| 2. How is the Sphere of Urban Influence determined? |  |
| 3. What are the characteristics of areas within the Sphere of Urban Influence? |  |
| 4. How does the Sphere of Urban Influence affect the surrounding regions? |  |
| 5. Can the Sphere of Urban Influence change over time? |  |


