Class 12 Economics: CBSE Sample Question Papers- Term II (2021-22)- 3 | Sample Papers for Class 12 Commerce PDF Download
Class-XII
Time: 120
Max. Marks: 40
General instructions:
- This is a Subjective Question Paper containing 13 questions.
- This paper contains 5 questions of 2 marks each, 5 questions of 3 marks each and 3 questions of 5 marks each.
- 2 marks questions are Short Answer Type Questions and are to be answered in 30-50 words.
- 3 marks questions are Short Answer Type Questions and are to be answered in 50-80 words.
- 5 marks questions are Long Answer Type Questions and are to be answered in 80-120 words.
- This question paper contains Case/Source Based Questions.
Q.1. Distinguish between National Income at Current Price and National Income at Constant Price.
OR
What is the difference between Gross Domestic Product at Market Price and Net National Product at Factor Cost?
The difference between National Income at Current Price and National Income at Constant Price are:
OR
The difference between Gross Domestic Product at Market Price and Net National Product at Factor Cost are:
Q.2. In an economy, the actual level of income is ₹ 100 crores, whereas, the full employment level of income is ₹ 500 crores. If half of additional income is saved, calculate increase in investment required to achieve full employment level of income.
OR
Find the national income from the following
Autonomous Consumption = ₹ 10,000
Marginal Propensity to consume = 0.25
Investment = ₹ 125.
Given: MPS = 0.5 (as half or 50% of additional income is saved)
Multiplier (K) = (1/MPS)
= 1/0.5 = 2
We also know : K = (Change in Income/Change in Investment)
= ΔY/ΔI
Given: Change in Income (ΔY) = 500 – 100 = ₹ 400 crores
i.e., = 400/Change in Investment (ΔI)
K = ΔY/ΔI
ΔI = 400/2 = 200
Hence, Change in Investment (ΔI) = ₹ 200 crores.
OR
We know : National Income (Y) = Consumption (C) + Investment (I)
Consumption Function = c + b(Y)
C = c + b(Y)
So, Y = c + b(Y) + I
Putting the value of c, b and I, we get
Y = 10,000 + 0.25 Y + 125
0.75 Y = 10125
Y = 10125/0.75 = 13,500
National Income (Y) = ₹ 13,500
Q.3. Why does full employment occur only in the absence of involuntary unemployment?
Justify the given statement.
Full employment refers to a situation in which every able – bodied person who is willing to work at the prevailing rate of wage is, in fact, employed. Full employment implies absence of involuntary unemployment. That is why full employment is also defined as a situation where there is no involuntary unemployment.
Q.4. How has women’s health become a matter of great concern?
OR
Compare and analyze the workforce in formal and informal sector based on following information:
Women’s health has become a matter of great concern because they suffer many disadvantages as compared to men.
- According to the 1991 census, there were 945 girls for every 1000 boys and in 2001, 927 girls for every 1000 boys. It indicates growing incidence of female foeticide in the country.
- Survey data show that even today there is a practice of getting married at an early age in our country. About three lakh girls are not only married under the age of fifteen, but have also become the mother of one child on an average. From these figures you can guess how much pain it is to become a mother in her immature age.
- More than 50% of married women between the age group of 15 and 49 have anaemia and nutritional anaemia, caused by iron deficiency, which has contributed to 19% of maternal deaths.
OR
The above table shows that out of 368 million total workers, only 28 million are employed in formal sector. It speaks that only 7% of total workforce is employed in the formal sector. The number of women workers is also lesser in the formal sector. It was experienced that employment in formal sector is not growing as required according to the above information.
Q.5. ‘Investment in infrastructure contributes to the economic development of a country.’
Justify the given statement with a valid argument.
The given statement is true; infrastructural development in an economy increases productivity, induces higher investment, facilitates employment, and generates more income. With the rise in income the quality of life of the people improves. Thus, conclusively we may say that infrastructure contributes to the economic development of a country.
Q.6. Giving valid reasons explain which of the following will not be included in estimation of National Income of India?
(a) Purchase of shares of X. Ltd. by an investor in the National Stock Exchange.
(b) Salaries paid by the French Embassy, New Delhi to the local workers of the housekeeping department.
(c) Compensation paid by the Government of India to the victims of floods.
OR
Estimate the value of Nominal Gross Domestic Product for a hypothetical economy, the value of Real Gross Domestic Product and Price Index are given as ₹ 500 crores and 125 respectively.
Following will not be included in estimation of National Income of India:
(a) As such transactions are mere paper claims and do not lead to any value addition.
(b) Compensation paid by the Government of India is mere transfer payment and does not lead to any flow of goods and services in an economy.
OR
Nominal GDP = Real GDP × (price index/100)
= 500 x (125/100)
= ₹ 625 crores
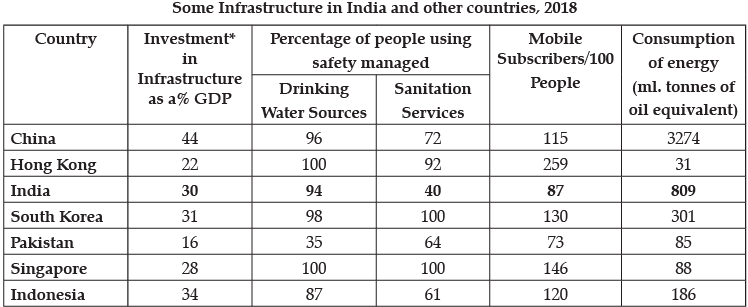
Q.7. Study the following information and compare the Economies of India and Singapore on the grounds of ‘Investment in infrastructure as a percentage of GDP ’
Sources: World Development Indicators 2019. Word Bank website: www.worldbank.org.: BP Statistical Review of World Energy 2019, 69th Edition.
Note: (*) refers to Gross Capital Formation.
Read the following text carefully and answer question number 8 and 9 given below:
SINO-PAK FRIENDSHIP CORRIDOR
The China-Pakistan Economic Corridor (CPEC) has deepened the decades–long strategic relationship between the two nations. But it has also sparked criticism for burdening Pakistan with mountains of debt and allowing China to use its debt -trap diplomacy to gain access to strategic assets of Pakistan.
The foundations of CPEC, part of China’s Belt and Road Initiative, were laid in May 2013. At the time, Pakistan was reeling under weak economic growth. China committed to play an integral role in supporting Pakistan’s economy.
Pakistan and China have a strategic relationship that goes back decades. Pakistan turned to China at a time when it needed a rapid increase in external financing to meet critical investments in hard infrastructure, particularly power plants and highways. CPEC’s early harvest projects met this need, leading to a dramatic increase in Pakistan’s power generation capacity, bringing an end to supply-side constraints that had made rolling blackouts a regular occurrence across the country.
Pakistan leaned into CPEC, leveraging Chinese financing and technical assistance in an attempt to end power shortages that had paralyzed its country’s economy. Years later, China’s influence in Pakistan has increased at an unimaginable pace.
China As Pakistan’s Largest Bilateral Creditor: China’s ability to exert influence on Pakistan’s economy has grown substantially in recent years, mainly due to the fact that Beijing is now Islamabad’s largest creditor. According to documents released by Pakistan’s finance ministry, Pakistan’s total public and publicly guaranteed external debt stood at $44.35 billion in June 2013, just 9.3 percent of which was owed to China. By April 2021, this external debt had ballooned to $90.12 billion, with Pakistan owing 27.4 percent —$24.7 billion — of its total external debt to China, according to the International Monetary Fund (IMF).
Additionally, China provided financial and technical expertise to help Pakistan build its road infrastructure, expanding north-south connectivity to improve the efficiency of moving goods from Karachi all the way to Gilgit-Baltistan (POK). These investments were critical in better integrating the country’s ports, especially Karachi, with urban centers in Punjab and Khyber-Pakhtunkhwa provinces.
Despite power asymmetries between China and Pakistan, the latter still has tremendous agency in determining its own policies, even if such policies come at the expense of the long term socioeconomic welfare of Pakistani citizens.
(https://www.usip.org/publications/2021/05/pakistans-growing-problem-its-china-economic-corridor - Modified)
‘Investment in infrastructure as a percentage of GDP ’ is that proportion of Gross Domestic Product which is invested for the development of infrastructural facilities in a country.
According to the given data it is evident that India is contributing 30% of its total GDP on infrastructural progress, which is just a notch above the corresponding figure of 28% for Singapore.
Considering the vast geography of India this is a relatively lower proportion in this direction. If India wants to grow at a faster rate, she must concentrate on higher judicious investment on development of infrastructure.
Q.8. Comment on the growth rate trends witnessed in China, Pakistan and India.
(i) China has the second largest GDP (PPP) of $ 22.5 trillion in the world, whereas, India’s GDP (PPP) is $ 9.03 trillion and Pakistan’s GDP is $ 0.94 trillion, roughly about 11 per cent of India’s GDP. India’s GDP is about 41 per cent of China’s GDP.
(ii) When many developed countries were finding it difficult to maintain a growth rate of even 5 per cent, China was able to maintain near double-digit growth during 1980s. In the 1980s, Pakistan was ahead of India; China was having double-digit growth and India was at the bottom.
(iii) In 2015–17, there has been a decline in Pakistan and China’s growth rates, whereas, India met with moderate increase in growth rates. Some scholars hold the reform processes introduced in Pakistan and political instability over a long period as reasons behind the declining growth rate in Pakistan.
Q.9. Compare and contrast India, Pakistan and China’s sectoral contribution towards GDP. What does it indicate?
(i) In 2018– 19, with 26 per cent of its workforce engaged in agriculture, its contribution to the GVA in China is 7 per cent. In both India and Pakistan, the contribution of agriculture to GVA were 16 and 24 per cent, respectively, but the proportion of workforce that works in this sector is more in India. In Pakistan, about 41 per cent of people work in agriculture, whereas, in India, it is 43 per cent.
(ii) Twenty - four per cent of Pakistan workforce is engaged in industry but it produces 19 per cent of GVA. In India, industry workforce account for 25 per cent but produces goods worth 30 per cent of GVA.
(iii) In China, industries contribute to GVA at 41, and employ 28 per cent of workforce. In all the three countries, service sector contributes highest share of GVA.
Q.10. What are externalities? Give an example of a positive externality and its impact on welfare of the people.
Externalities refer to the benefits or harms a firm or an individual cause to another for which they are not paid. These externalities can be positive as well as negative. A positive externality exists when an individual or firm making a decision does not receive the full benefit of the decision, e.g. Immunisation prevents an individual from getting a disease, but has the positive effect of the individual not being able to spread the disease to other.
It enhances the overall welfare of the society and creates positive externalities.
Q.11. "An economy is operating at under-employment level of income.” What is meant by the given statement? Discuss one fiscal measure and one monetary measure to tackle the situation.
When the planned aggregate expenditure is less than the output available in the economy that would have been in case of full employment level, the economy is said to be working at the underemployment level. The available output in this situation is excess over the anticipated aggregate demand at the full employment level. The situation of underemployment equilibrium can be overcome by increasing the level of aggregate demand to the level of the stocks that can be cleared.
Following measures may be taken for the same:
(i) Decrease in taxes: The government can decrease the prevailing tax rates for both direct and indirect taxes. This will lead to an increase in the purchasing power of the people. This in turn will lead them to demand more, increasing the aggregate demand and remove the situation of deflation and deflationary gap.
(ii) Increase in money supply: The Central bank could use the expansionary monetary policy to increase the money supply in the economy. The bank rate, cash reserve ratio, repo rate, reverse repo rate could be decreased, so that more money can be in circulation. This increase in money supply will lead to an increase in the aggregate demand and remove the situation of deflationary gap.
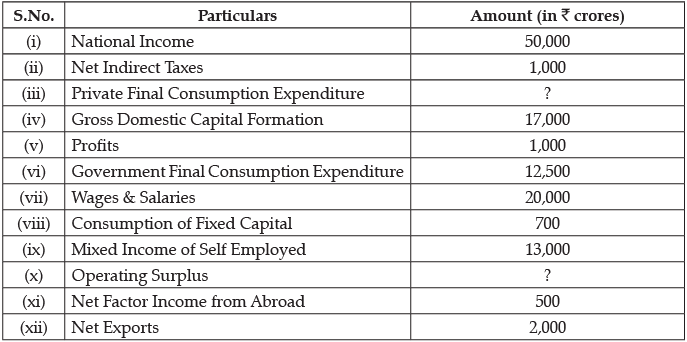
Q.12. (a) Given the following data, find the missing value of ‘Private Final Consumption Expenditure’ and ‘Operating Surplus’.
(b) Define the problem of double counting in the computation of national income. State any two approaches to correct the problem of double counting.
OR
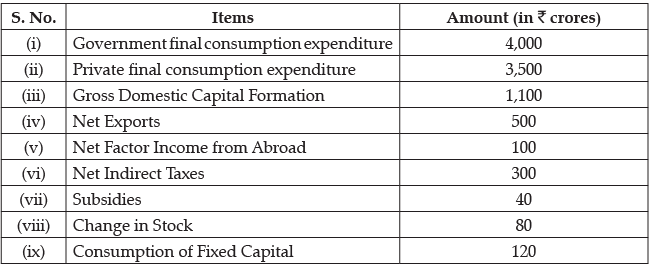
(a) Calculate (i) Gross domestic product at market price, and (ii) National income:
(b) What is macroeconomics?
(a) Operating Surplus = National Income – [ Wages & Salaries + Mixed Income of Self Employed + Net Factor Income from Abroad]
Operating Surplus = (i) – [(vii) + (ix) + (xi)]
= 50,000 – (20,000 + 13,000 + 500)
= ₹ 16,500 crores
Private Final Consumption Expenditure = National Income – [ Gross Domestic Capital Formation + Government Final Consumption Expenditure + Net Factor Income from Abroad + Net Exports] + Wages & Salaries + Net Indirect Taxes
= (i) – [(iv) + (vi) + (xi) + (xii)] + (vii) + (ii)
= 50,000 – (17,000 + 12,500 + 2,000 + 500) + 700 + 1,000 = 19,700 crore
(b) The problem of double counting arises when the value of some goods and services are counted more than once while estimating national income.
Two ways to avoid double counting are:
(i) Deduct intermediate consumption from the value of output to arrive at value added
(ii) Take the value of final product only;
OR
(a) Gross Domestic Product at Market Price
GDPMP = Government final consumption expenditure + Gross Domestic Capital Formation + Net Exports
= (i) + (ii) + (iii) + (iv)
GDPMP = 4,000 + 3,500 + 1,100 + 500
GDPMP = 9,100 crore
(ii) National Income
NNPFC = GDPMP – Consumption of Fixed Capital + Net Factor Income from Abroad – Net Indirect Taxes
NNPFC = GDPMP – (ix)+ (v) – (vi)
NNPFC = 9,100 – 120 + 100 – 300
NNPFC = 8,880 crore
(b) Macroeconomics studies economic problems at the level of an economy as a whole. It is concerned with the determination of aggregate output and general price level in which are not concerned with an individual rather the economy as a whole. It is the study of aggregates of the economy as a whole. Study of macroeconomics includes Aggregate consumption, Aggregate investment, Aggregate Demand (AD), Aggregate Supply (AS), Domestic income and General price level.
Q.13. (a) ‘India has emerged as a hotspot for medical tourism’. Defend the statement with valid arguments.
(b) Special Economic Zones increase foreign Investment. Explain.
(a) The given statement is defended as in the recent past India witness many foreign nationals visiting for surgeries, organ transplant, dental and even cosmetic care.
This is because:
(i) Health services in India supported with latest medical know – how and qualified professionals.
(ii) Medical Services are much less expensive in India compared to most countries in the world.
(b) SEZ is a geographical region that has economic laws different from a country ’s typical economic laws. SEZs attract foreign investors since they offer high quality infrastructure facilities and support services. Besides allowing duty free import of capital goods and raw-materials attractive fiscal incentives and simpler customs, banking and other procedures are offered in such zones.
|
130 docs|5 tests
|


