Analyse Data using Scenarios & Goal Seek | Information Technology for Class 10 PDF Download
| Table of contents |

|
| Use Consolidating Data |

|
| Introduction to subtotal |

|
| Using “What If” scenarios |

|
| Multiple Operations in OO Calc |

|
| What is Goal Seek? |

|
| Goal Seek in OO Calc |

|
Use Consolidating Data
Consolidating data is a useful feature for automating information and saving time when the same data is needed across different sheets. In spreadsheet software, users often work with multiple worksheets and may require the same information in various sheets but with different values.
For example, consider the data of students in a class who took different exams such as periodic test 1, periodic test 2, and so on. Similarly, think about the sales data from different sales representatives of a company for periods like quarterly or monthly. To achieve a common business objective or specific aim, it is necessary to analyze and summarize this data.
Consolidating data meaning
Consolidate means that to combine a number of things into a single unit. Consolidating of data means that the process of combining the number of data organized into different sheets into one worksheet or cell.
Let consider one of the above examples that student data are given in a screenshot.
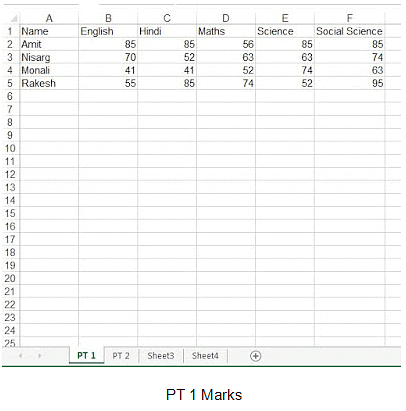
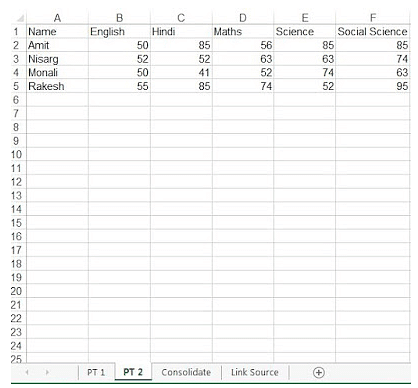
In the above example, I have marks of two periodic tests. Screenshot 1 is having PT 1 marks and Screenshot 2 is having PT 2 marks. Now in sheet 3, I need to use formulas on data to compute results. This process is known as consolidating data.
Steps to Consolidating Data in MS Excel
- Open the workbook in which you have prepared data.
- Now click and place the cursor in the cell in the new worksheet where you want to display consolidated data. If the worksheet is not available then insert a new worksheet.
- Click on Data ⇢ Consolidate.

The consolidate dialog box will appear.
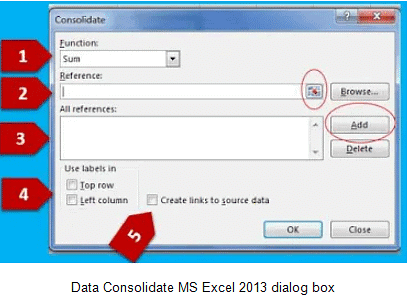
As you can see in the above screenshot consolidate dialog box contains 5 options highlighted.
- Function: In this option, you can select your desired function to display consolidated results.
- Reference: This option allows you to select the reference from another sheet having data. Click on the circled button to select a reference. Click on the Add button to use the reference. Repeat the same step to add all the references.
- All references: Display the added references from the workbook.
- Use labels in: This option allows us to use the row headers and column headers of worksheets.
- Create links to source data: When you select this option data will automatically update the values when any change happens to referenced cells. Finally, click on OK button.
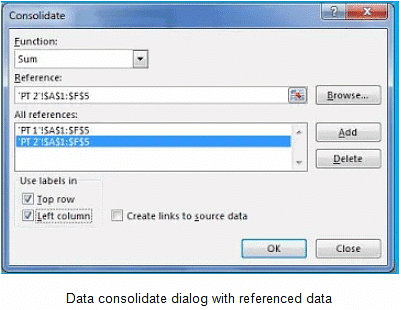
Observe the following screenshot, I have added references for the above-mentioned sheets.
Steps to Consolidating Data in OO Calc:
Prepare your worksheets for data consolidation and follow these steps:
- Click on Data ⇢ Consolidate option. A consolidate dialog box will appear.
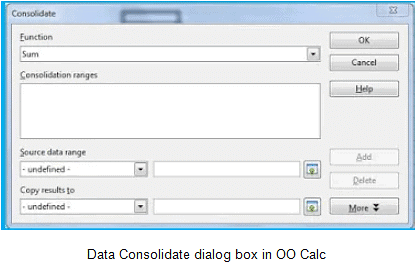
- The dialog is almost similar like MS Excel. Select your desired function and add references to the cells by selecting ranges.
- Click on more button to add row labels and column labels or to link source data.
Define a range
This option is useful for consolidate data in OO calc. So follow these steps to define a range in OO Calc.
- Select the cells for which you want to create a range.
- Click on Insert ➝ Names ➝ Define or press Ctrl + F3. A Define Names Dialog box will appear on the screen.
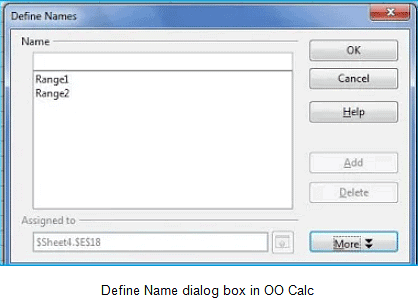
- Type the range in the Name box. Do not use space in range names.
- The Add button will active click on that.
- Click on OK.
Introduction to subtotal
Spreadsheet software provides powerful features to analyze your data. There are some advanced features that can help to perform some advanced functions on the formula results. Subtotal is one of them. Subtotal is used to display your formula results according to columns group and row labels. There are two methods to achieve the same thing in spreadsheet software.
- Subtotal() formula: The subtotal() formula to group the results.
- Data → Subtotals command: The graphical command to do subtotals.
Using subtotal in MS Excel
Before you start searching the subtotals option into the ribbon prepare your data in the worksheet. I have created data on the score of different houses as given the screenshot below.
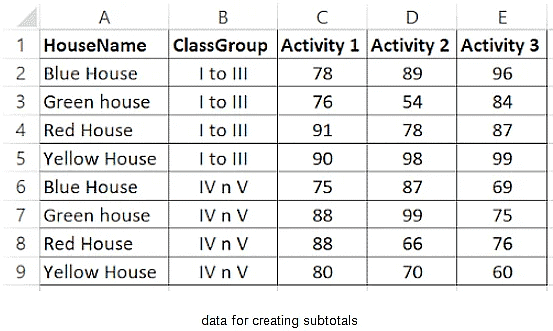
Now follow these steps to create subtotals:
Step 1: Click on Data → Subtotal from the outline group.

The Subtotals dialog box will appear as displayed in the following screenshot.
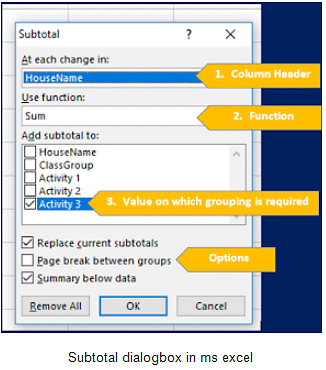
Step 2: Select the column header on which you want to apply subtotal.
Step 3: The second option is to use a function where you can select a function to display the results.
Step 4: After selecting the function select the values on which grouping is required.
Step 5: You can select the option as per your need from different options from the following:
- Replace current subtotals: This option is used to replace the values of subtotals.
- Page break between groups: It will start a new page from the new group.
- The summary below data: It will display the summary below the group.
- Remove all: To previous subtotals
Step 6: Click on the ok button.
Observe the result is given in the following screenshot where I have applied subtotal on the class group column.
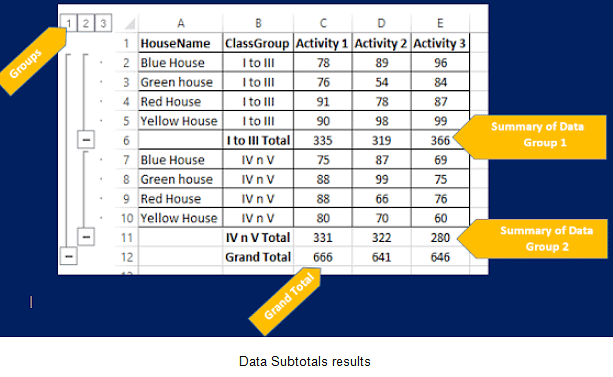
Using subtotal in OpenOffice Calc
Step 1: Click on Data → Subtotals.
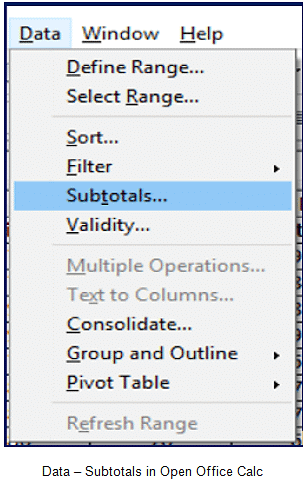
A subtotals dialog box appears as displayed in the following screenshot:
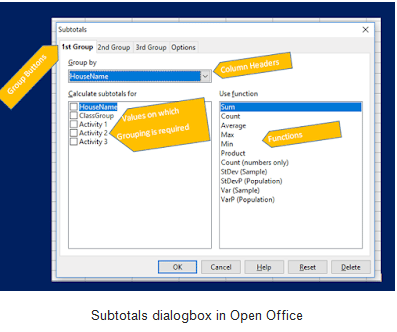
Step 2: There are 3 group tab buttons given, so you can group your columns from data up to 3 groups. The options tab contains different options as displayed in the following screenshot:
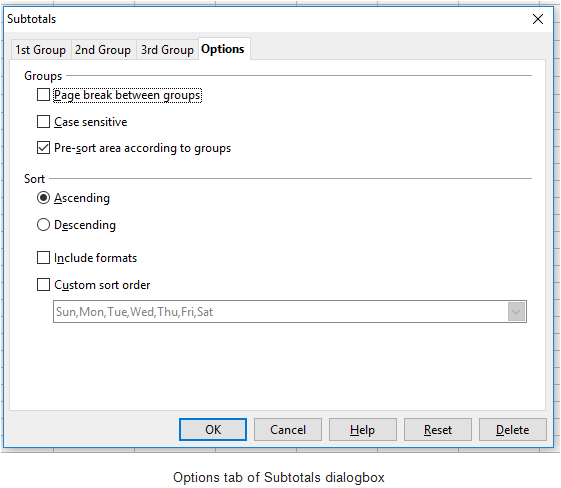
The first option groups are similar as explained in the MS Excel section. The second option is given for sorting records. You can sort either ascending or descending order. Include formats option allows to attach the format applied in the column header.
Step 3: Select the group options and functions and click on OK.
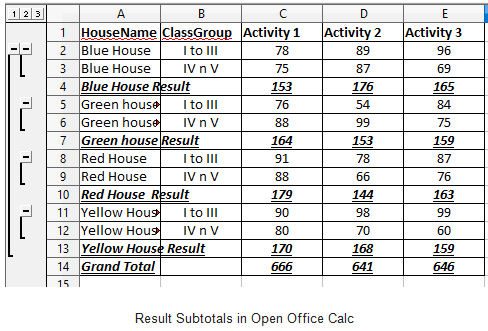
Now observe the following output screen.
Using “What If” scenarios
The “What If” scenario feature allows us to create different target-based “What If” analysis. Suppose we are playing a clicket tournament where we need to analyze our team performance on the net run rate we can use “What If” scenarios. Moreover, it can help in every match to achieve the target in different conditions.
These different conditions means
- How many runs are required in how many overs to qualify on top of the point table?
- How many runs need to be saved to climb up in the point table? etc.
You can create scenarios with different names and targets. These scenarios you can view any time from the scenarios manager.
Using “What If” scenarios in MS Excel
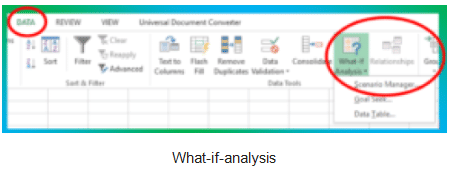
MS Excel provides What-If-Analysis command in the Data tab to use “What IF” scenarios. Prepare your data in advance and open the worksheet then follow the given steps. I have used the following data for this purpose.
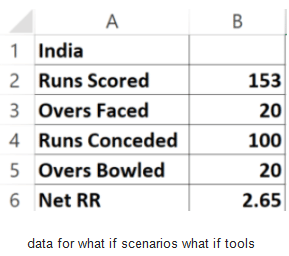
Step 1: Select data and click on Data → What – if – Analysis → Scenario Manager. Observe the following screenshot:
Step 2: Click on the scenario manager. The Scenario Manager dialog box appears as displayed in the following screenshot.
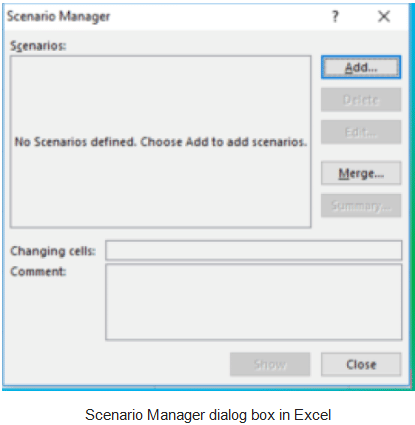
This dialog box has the following options:
- Scenario Details Preview: It shows the details of the scenarios.
- Add: You can add a new scenario by clicking this option.
- Delete: You can delete an existing scenario that is unwanted.
- Edit: You can edit an existing scenario.
- Merge: It is useful, If more than one scenario needs to be added
- Summary: It shows a summary of the scenario.
- Changing Cells: Select the cells in which values are going to be changed.
- Comment: If any additional text is required then you can insert it.
- Show: Display the information of the selected scenario.
- Close: To close the scenario manager.
Step 3: Click on the Add button. Add scenario dialog box will appear as displayed in the below-given screen shot.
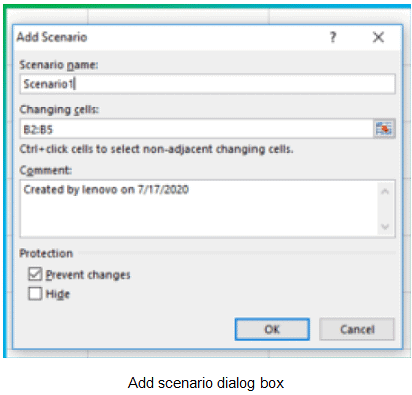
Type the scenario name as I have scenario1, you can change cells by selecting changing cells options. Type your comments if you want to type in the comment box. Click on the OK button. Scenario values dialog box appears as displayed in the following dialog box.
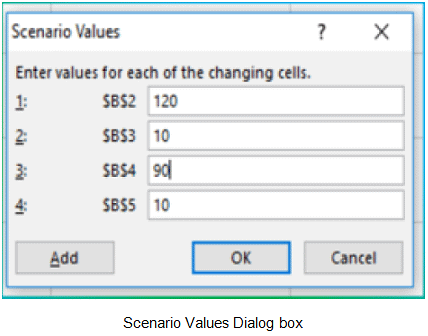
Step 4: Now enter the target values in the respective cells. My target which I want to use for this scenario is 120 runs in 10 overs and want to concede 90 runs in 10 overs to see the net run rate variations. So I have changed these values respectively.
Step 5: Click on the Add button. Repeat the same steps for more scenarios.
Check the result of the scenario
To check the scenario result follow these steps:
Step 1: Open the scenario manager.
Step 2: Select the scenario which results you want to check. Click on the scenario name.
Step 3: Click on the show button.
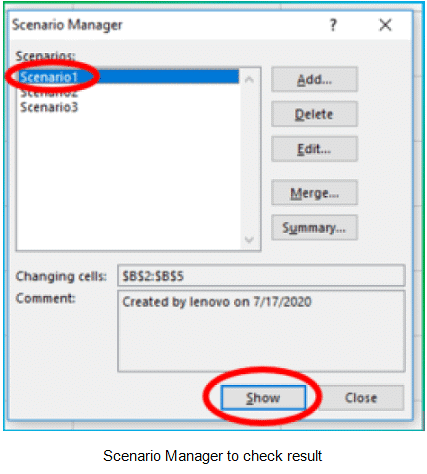
The result will be displayed in the excel worksheet.
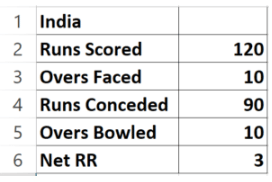
Using “What If” scenarios in OO calc
Consider similar data as used in MS Excel example. Follow the below-given steps to use the “What-if” scenario in OO Calc.
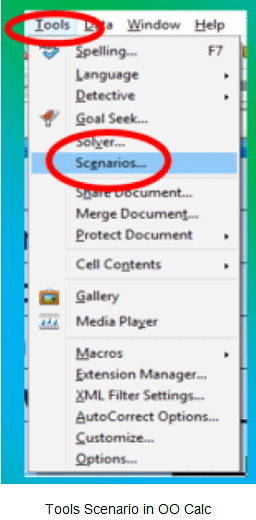
Step 1: Type the required values in the excel sheets and click on Tools → Scenarios option.
Step 2: A create scenario dialog box appears as displayed in the following screenshot.
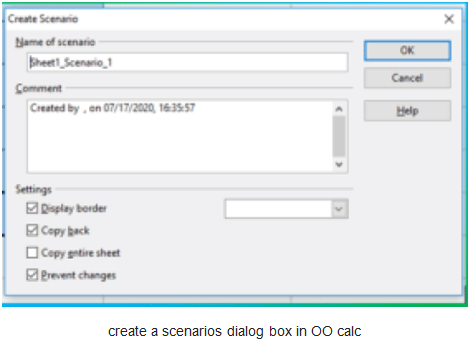
Create scenario dialog box options
- Name of Scenario: Type the name of the scenario.
- Comment: Type the remarks or comments related to the scenario.
- Settings: It allows to change the display border colour, copy the contents, copy the entire sheet as well as the prevention changes.
- OK: When set up is complete click the OK button.
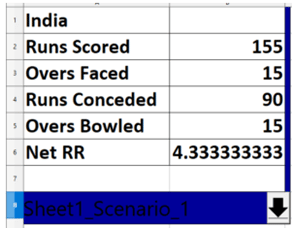
Step 3: Apply the settings you need in your current scenario and click on the OK button. I have applied a blue border to a scenario and changed the value runs scored 80 and runs conceded 75 and the result is 0.5. Observe the following screenshot.
Multiple Operations in OO Calc
The scenario allows us to perform a task on a single set of values at a time. But what if you want to see multiple results at the same time? So OO calc provides a strong feature named Multiple operations to do the same thing. You can set input row values according to the row or columns.
Type the target values in the desired cells in a single column. I have typed the assumed target in a column displayed in the screenshot.
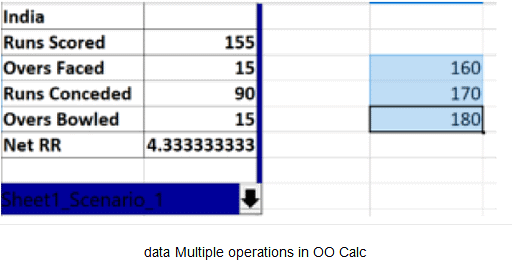
Select the data along with the adjacent column and follow the below-given steps:
Step 1: Click on Data → Multiple Operations. Multiple operations dialog box appears have look in the following screenshot.
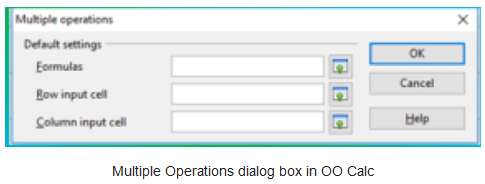
This dialog box consists of three options:
- Formulas: Select the cell where formula is entered.
- Row input cell: Select the cell for the input values that are entered in rows.
- Column input Cell: Select the cell for the input values that are entered in columns.
Step 2: As per my data, the values are stored in a column and the formula is entered in B6. For column input cell I have selected the cell B2. Observe the following screenshot.
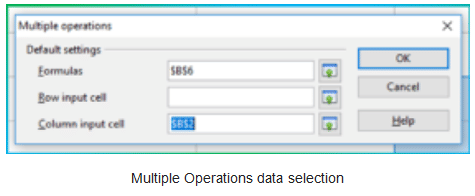
Step 3: Click on the OK button. You will get the desired result. Observe the following screenshot.
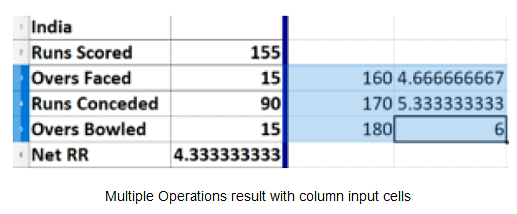
Similarly, you can type the values in a row and check multiple operations result accordingly.
What is Goal Seek?
Goal seek is an advanced spreadsheet feature that allows to provides the values for the target based input. Just decide the target value and you can select which cell should be changed in goal seek dialog box.
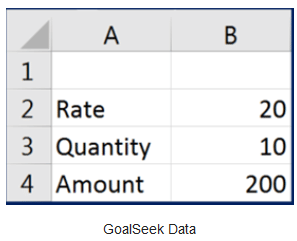
In the above screenshot, Rate and Quantity are given and the amount is computed accordingly. Now I want to achieve the target amount of 500, so what should be rate can be or how many quantities required for the same, goal seek helps to do the same.
- Select the cell where the formula is written. For my example, I have placed the cursor in B4.
- Click on Data → What-if Analysis → Goal Seek option from the forecast group.
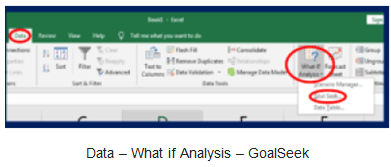
- A GoalSeek dialog box will appear as displayed in the following screenshot:
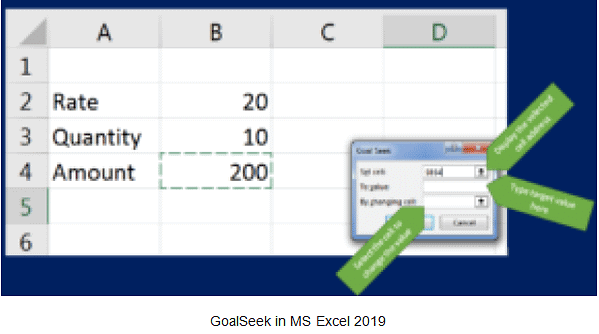
- Type the desired value i.e. 500 in To Value box and select the cell address for by changing cell option as displayed in the following screenshot.
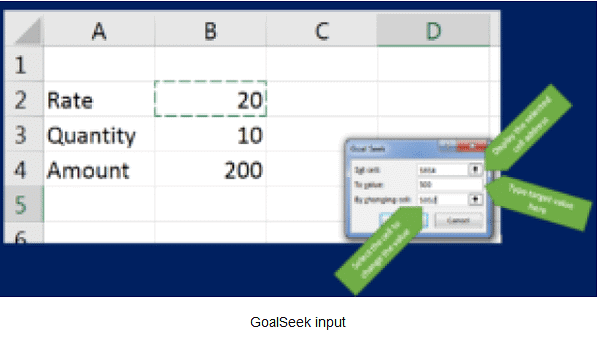
- Click on OK button the values will be displayed in your worksheet as displayed in the following screenshot.
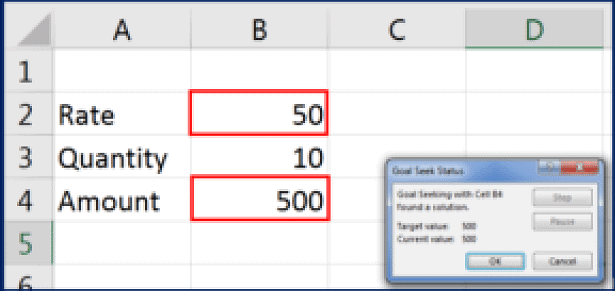
- Click on OK button to accept the result, click cancel to return with original data.
Goal Seek in OO Calc
- Place the cursor in B4 cell and click on Tools → GoalSeek option
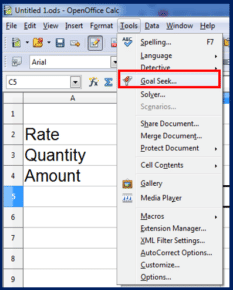
- A Goal Seek dialog box appears as displayed in the following screenshot.
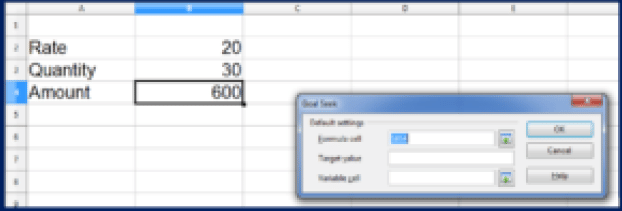
- Type the desired value for target value and select the variable cell to display the changed value. Observe this dialog box.
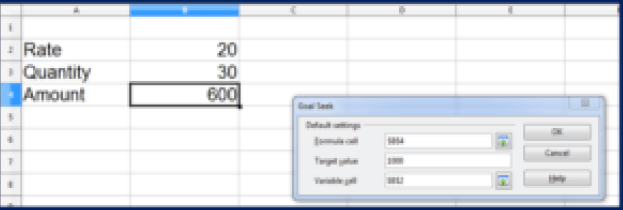
- Now click on OK button. A result will be displayed in a new dialog box. Observe the following screenshot.
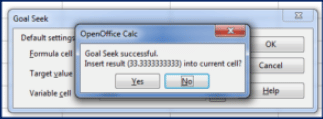
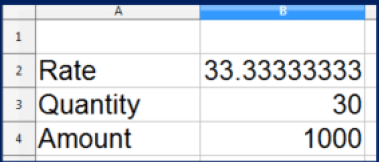
- Click on Yes button to accept the value. The result will be displayed as below given screen shot.
Solver in OO Calc
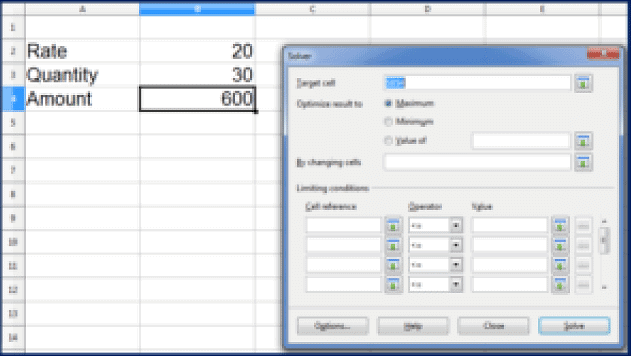
GoalSeek allows displaying the target based results on a single value or condition. Whereas the solver is used to optimize the result based on conditions. Follow the given steps to use solver:
- Place the cursor in the cell where the formula is entered.
- Now Click on Tools → Solver.
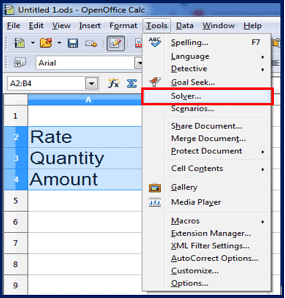
- Now, a solver dialog box will appear as displayed in the following screenshot

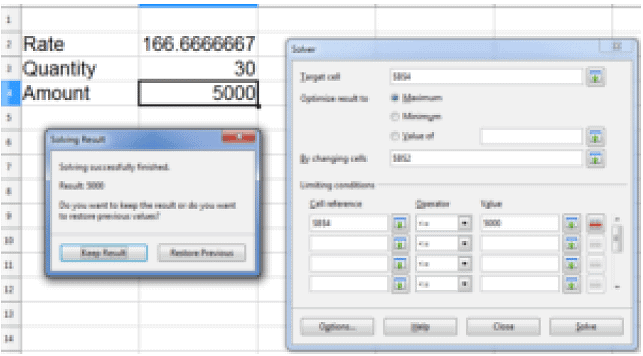
- Select the optimized result to option, select the by changing cells and provide the value in limiting conditions. Observe the following screenshot of what I have done!

- Click on the Keep result button to accept the changes otherwise click on restore previous.
|
4 videos|28 docs|8 tests
|
FAQs on Analyse Data using Scenarios & Goal Seek - Information Technology for Class 10
| 1. What is the purpose of using subtotals in data analysis? |  |
| 2. How can “What If” scenarios be useful in OO Calc? |  |
| 3. What operations can be performed using multiple operations in OO Calc? |  |
| 4. What is Goal Seek and how is it used in OO Calc? |  |
| 5. How can scenarios and Goal Seek be analyzed together in OO Calc? |  |

