Sample Essay: Bar Graph - 3 | Writing for Academic IELTS PDF Download

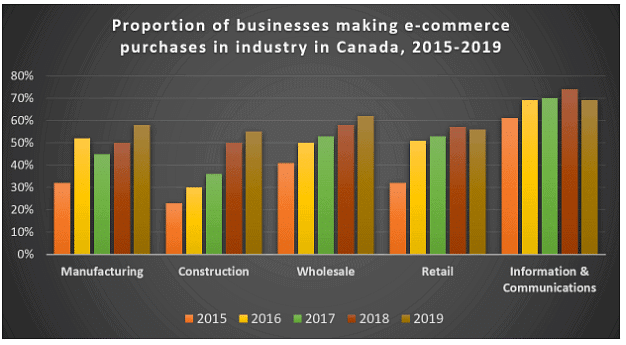
Q. The chart below shows the proportion of businesses making e-commerce purchases by industry in Canada between 2015 and 2019.
Sample Answer:
The bar chart illustrates the percentage of businesses engaging in e-commerce purchases across five industries in Canada from 2015 to 2019. Overall, the data reveals a general upward trend in online purchasing across all sectors, with the information and communications industry consistently leading, while construction shows the most significant growth.
In 2015, the information and communications sector had the highest proportion at approximately 62%, peaking at 75% in 2018 before settling at 68% in 2019. The retail sector followed a similar trajectory, rising steadily from 35% in 2015 to 55% in 2019, with a high of 58% in 2018. Wholesale businesses also increased, albeit more gradually, from 42% to 60% over the period. In contrast, the construction industry, starting at a modest 23% in 2015, surged to 52% by 2019, nearly doubling its involvement. Manufacturing mirrored this growth, climbing from 33% to 58%, reflecting a near 100% proportional increase.
In summary, while all industries embraced e-commerce more over time, information and communications maintained dominance, and construction exhibited the most dramatic rise.
(165 words)
|
30 videos|206 docs|17 tests
|
FAQs on Sample Essay: Bar Graph - 3 - Writing for Academic IELTS
| 1. What does the bar graph in the article titled "Sample Essay: Bar Graph - 3 IELTS" represent? |  |
| 2. Which leisure activity has the highest number of hours spent by students according to the bar graph? | |
| 3. Which leisure activity has the lowest number of hours spent by students according to the bar graph? | |
| 4. How many hours do students spend on average on leisure activities according to the bar graph? | |
| 5. Is there a significant difference in the number of hours spent by male and female students on leisure activities according to the bar graph? | |


Viva Questions
,video lectures
,Previous Year Questions with Solutions
,study material
,mock tests for examination
,Sample Essay: Bar Graph - 3 | Writing for Academic IELTS
,Exam
,Objective type Questions
,MCQs
,ppt
,Summary
,Extra Questions
,Sample Paper
,Sample Essay: Bar Graph - 3 | Writing for Academic IELTS
,shortcuts and tricks
,Sample Essay: Bar Graph - 3 | Writing for Academic IELTS
,practice quizzes
,Semester Notes
,Free
,Important questions
,past year papers
,


Sample Essay: Bar Graph - 3 Free PDF Download
Importance of Sample Essay: Bar Graph - 3
Sample Essay: Bar Graph - 3 Notes
Sample Essay: Bar Graph - 3 IELTS Questions
Study Sample Essay: Bar Graph - 3 on the App
|
© EduRev
|
Education Revolution
|


|


within 7 days!