
From 2021 to 2025, CAT DI included multiple chart-based sets each year, typically one major data interpretation set (4-6 questions) per slot. These sets involved radar charts, bar charts, candlestick plots, timeline charts, and tabular data, testing percentage calculations, ratios, weighted averages, trade balances, and logical interpretation. Most questions were calculation-intensive but moderate in difficulty, requiring careful data extraction and multi-step reasoning.
CAT Exam > CAT Notes > Logical Reasoning (LR) & Data Interpretation (DI) > CAT Previous Year Questions: Bar Graphs
CAT Previous Year Questions: Bar Graphs
2025
Q1 to Q4:
Five countries engage in trade with each other. Each country levies import tariffs on the other countries. The import tariff levied by Country X on Country Y is calculated by multiplying the corresponding tariff percentage with the total imports of Country X from Country Y.
The radar chart below depicts different import tariff percentages charged by each of the five countries on the others. For example, US (the blue line in the chart) charges 20%, 40%, 30%, and 30% import tariff percentages on imports from France, India, Japan, and UK, respectively. The bar chart depicts the import tariffs levied by each county on other countries. For example, US charged import tariff of 3 billion USD on UK.
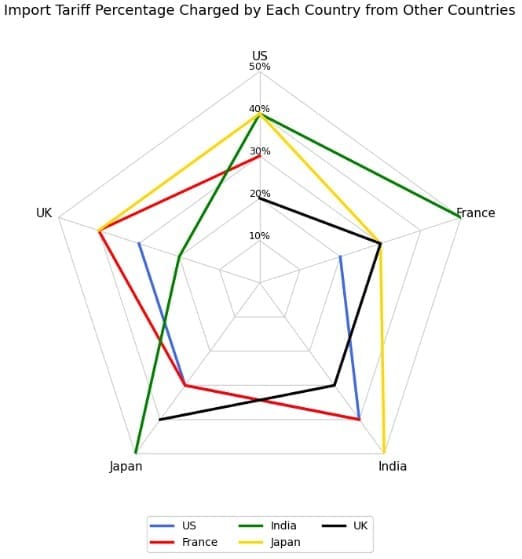
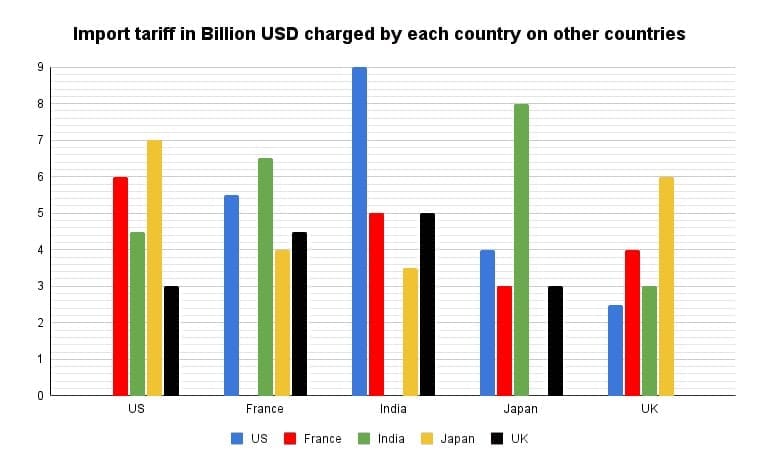
Assume that imports from one country to another equals the exports from the latter to the former.
The trade surplus of Country X with Country Y is defined as follows.
Trade surplus = Exports from Country X to Country Y - Imports to Country X from Country Y.
A negative trade surplus is called trade deficit.
Q1: How much is Japan's export to India worth?
(a) 8.5 Billion USD
(b) 16.0 Billion USD
(c) 7.0 Billion USD
(d) 1.75 Billion USD
Ans: c
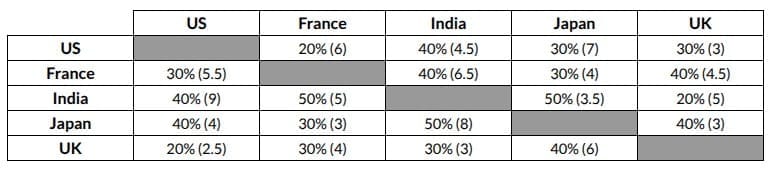
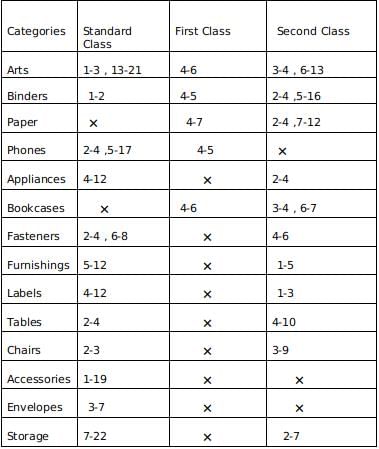
Sol: The values given in both charts together are represented in the table below, with the import tariff percentages charged by each of the five countries on the others represented as a percentage, and the import tariffs levied by each country on other countries are represented in brackets(in billion USD).
Japan's export to India would be the same as India's import from Japan.
India is charging a 50% tariff on Japan, and the tariff by India on Japan equals 3.5 billion USD.
So, 50% of the imports equals 3.5 billion USD.
The value of imports by India from Japan = Japan's export to India = 7 billion USD.
Hence, the correct answer is option C.
Q2: Which among the following is the highest?
(a) Exports by Japan to UK
(b) Imports by US from France
(c) Exports by France to Japan
(d) Imports by France from India
Ans: b
Sol: The values given in both charts together are represented in the table below, with the import tariff percentages charged by each of the five countries on the others represented as a percentage, and the import tariffs levied by each country on other countries are represented in brackets(in billion USD).
Option A) Exports by Japan to the UK would be the same as the UK's imports from Japan.
The UK is charging a 40% tariff on Japan, and the tariff imposed by the UK on Japan equals 6 billion USD.
So, 40% of the imports equals 6 billion USD.
The value of imports by the UK from Japan = Japan's export to the UK = 15 billion USD.
Option B) Imports by the US from France.
The US is charging a 20% tariff on France, and the tariff by the US on France equals 6 billion USD.
So, 20% of the imports equals 6 billion USD.
The value of imports by the US from France = 30 billion USD.
Option C) Exports by France to Japan would be the same as Japan's imports from France.
Japan is charging a 30% tariff on France, and the tariff by Japan on France equals 3 billion USD.
So, 30% of the imports equals 3 billion USD.
The value of imports by Japan from France = France's export to Japan = 10 billion USD.
Option D) Imports by France from India.
France is charging a 40% tariff on India, and the tariff by France on India equals 6.5 billion USD.
So, 40% of the imports equals 6.5 billion USD.
The value of imports by France from India = 16.25 billion USD.
Out of all the options, the value of imports by the US from France is the highest.
Hence, the correct answer is option B.

Q3: What is the trade surplus/trade deficit of India with UK?
(a) Surplus of 15.0 Billion USD
(b) Deficit of 15.0 Billion USD
(c) Surplus of 10.0 Billion USD
(d) Deficit of 10.0 Billion USD
Ans: b
Sol: The values given in both charts together are represented in the table below, with the import tariff percentages charged by each of the five countries on the others represented as a percentage, and the import tariffs levied by each country on other countries are represented in brackets(in billion USD).
Trade surplus/trade deficit of India with the UK = Exports from India to the UK - Imports from India to the UK
Exports by India to the UK would be the same as the UK's imports from India.
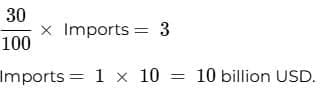
The UK is charging a 30% tariff on India, and the tariff imposed by the UK on India equals 3 billion USD.
So, 30% of the imports equals 3 billion USD.
The value of imports by the UK from India = India's export to the UK = 10 billion USD.
Imports by India from the UK can be calculated as,
India is charging a 20% tariff on the UK, and the tariff imposed by India on the UK equals 5 billion USD.
So, 20% of the imports equals 5 billion USD.
The value of imports by India from the UK = 25 billion USD.
We can clearly see that the Imports are greater than the exports for India from the UK. So, the trade deficit can be calculated as,
Trade deficit = Exports from India to the UK - Imports from India to the UK = 10 billion USD - 25 billion USD = -15 billion USD.
So, there is a deficit of 15 billion USD.
Hence, the correct answer is option B.

Q4: Among France and UK, who has/have trade surplus(es) with US?
(a) Neither France nor UK
(b) Both France and UK
(c) Only UK
(d) Only France
Ans: d
Sol: The values given in both charts together are represented in the table below, with the import tariff percentages charged by each of the five countries on the others represented as a percentage, and the import tariffs levied by each country on other countries are represented in brackets(in billion USD).
For France - Trade surplus/trade deficit of France with the US = Exports from France to the US - Imports from the US to France
Exports by France to the US would be the same as the US's imports from France.
The US is charging a 20% tariff on India, and the tariff imposed by the US on France equals 6 billion USD.
So, 20% of the imports equals 6 billion USD.
The value of imports by the US from France = France's export to the US = 30 billion USD.
Imports by France from the US can be calculated as,
France is charging a 30% tariff on the US, and the tariff imposed by France on the US equals 5.5 billion USD.
So, 30% of the imports equals 5.5 billion USD.
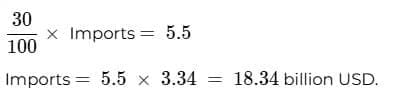
The value of imports by France from the US = 18.34 billion USD.
We can clearly see that the Imports are less than the exports for France from the US. So, the trade surplus can be calculated as,
Trade surplus = Exports from France to the US - Imports from France to the US = 30 billion USD - 18.34 billion USD = 11.67 billion USD.
So, there is a surplus of 11.67 billion USD.
For the UK - The Trade surplus/trade deficit of the UK with the US = Exports from the UK to the US - Imports from the US to the UK
Exports by the UK to the US would be the same as the US's imports from the UK.
The US is charging a 30% tariff on the UK, and the tariff imposed by the US on the UK equals 3 billion USD.
So, 30% of the imports equals 3 billion USD.
The value of imports by the US from the UK = The UK's export to the US = 10 billion USD.
Imports by the UK from the US can be calculated as,
The UK is charging a 20% tariff on the US, and the tariff imposed by the UK on the US equals 2.5 billion USD.
So, 20% of the imports equals 2.5 billion USD.
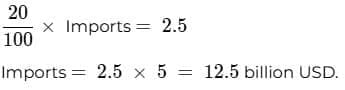
The value of imports by the UK from the US = 12.5 billion USD.
We can clearly see that the Imports are greater than the exports for the UK from the US. So, the trade deficit can be calculated as,
Trade deficit = Exports from the UK to the US - Imports from the UK to the US = 10 billion USD - 12.5 billion USD = -2.5 billion USD.
So, there is a deficit of 2.5 billion USD.
We can see that France has a surplus and the UK has a deficit with the UK.
Hence, the correct answer is option D.

2024
Direction: Answer the following questions based on the information given.
The chart below shows the price data for seven shares - A, B, C, D, E, F, and G as a candlestick plot for a particular day. The vertical axis shows the price of the share in rupees. A share whose closing price (price at the end of the day) is more than its opening price (price at the start of the day) is called a bullish share; otherwise, it is called a bearish share. All bullish and bearish shares are shown in green and red colour respectively.
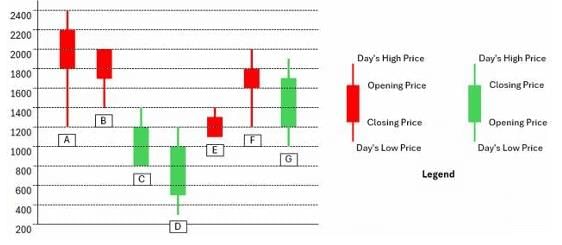
Q1: Daily Share Price Variability (SPV) is defined as (Day's high price - Day's low price) / (Average of the opening and closing prices during the day). Which among the shares A, C, D and F had the highest SPV on that day?
(a) F
(b) A
(c) C
(d) D
Ans: (d)
Explanation: Use SPV = (day's high - day's low) / ((opening + closing)/2). Compute for each stock (values taken from the candlestick data shown):
For stock A:
High = 2400, Low = 1200, Opening = 2200, Closing = 1800
Average of open and close = (2200 + 1800)/2 = 2000
SPV_A = (2400 - 1200)/2000 = 1200/2000 = 0.60
For stock C:
High = 1400, Low = 800, Opening and closing average = (1200 + 800)/2 = 1000
SPV_C = (1400 - 800)/1000 = 600/1000 = 0.60
For stock D:
High = 1200, Low = 300, Opening and closing average = (1000 + 500)/2 = 750
SPV_D = (1200 - 300)/750 = 900/750 = 1.20
For stock F:
High = 2000, Low = 1200, Opening and closing average = (1800 + 1600)/2 = 1700
SPV_F = (2000 - 1200)/1700 = 800/1700 ≈ 0.47
Comparing these, stock D has the highest SPV (1.20). Hence (d) is correct.
Q2: Daily Share Price Variability (SPV) is defined as (Day's high price - Day's low price) / (Average of the opening and closing prices during the day). How many shares had an SPV greater than 0.5 on that day?
Ans: 4
Explanation: Compute SPV for each stock and check which exceed 0.5. (Values from the candlestick data.)
For stock A:
SPV_A = (2400 - 1200)/((2200 + 1800)/2) = 1200/2000 = 0.60 > 0.5
For stock B:
SPV_B = (2000 - 1400)/((2000 + 1700)/2) = 600/1850 ≈ 0.324 < 0.5
For stock C:
SPV_C = (1400 - 800)/((1200 + 800)/2) = 600/1000 = 0.60 > 0.5
For stock D:
SPV_D = (1200 - 300)/((1000 + 500)/2) = 900/750 = 1.20 > 0.5
For stock E:
SPV_E = (1400 - 1100)/((1100 + 1300)/2) = 300/1200 = 0.25 < 0.5
For stock F:
SPV_F = (2000 - 1200)/((1800 + 1600)/2) = 800/1700 ≈ 0.47 < 0.5
For stock G:
SPV_G = (1900 - 1000)/((1200 + 1700)/2) = 900/1450 ≈ 0.62 > 0.5
Stocks with SPV > 0.5 are A, C, D and G. Thus, four stocks satisfy the condition.
Q3: Daily loss for a share is defined as (Opening price - Closing price) / (Opening price). Which among the shares A, B, F and G had the highest daily loss on that day?
(a) F
(b) A
(c) G
(d) B
Ans: (b)
Explanation: Daily loss = (Opening - Closing)/Opening. Compute for each specified stock (values from the candlestick):
For A:
Opening = 2200, Closing = 1800
Daily loss_A = (2200 - 1800)/2200 = 400/2200 = 2/11 ≈ 0.1818 (≈18.18%)
For B:
Opening = 2000, Closing = 1700
Daily loss_B = (2000 - 1700)/2000 = 300/2000 = 3/20 = 0.15 (15%)
For F:
Opening = 1800, Closing = 1600
Daily loss_F = (1800 - 1600)/1800 = 200/1800 = 1/9 ≈ 0.1111 (≈11.11%)
For G: no calculation is required since G is a bullish share (closing > opening) and does not register a loss.
Comparing the computed values, A has the largest daily loss (~18.18%). Thus option (b) is correct.
Q4: What would have been the percentage wealth gain for a trader, who bought equal numbers of all bullish shares at opening price and sold them at their day's high?
(a) 50%
(b) 80%
(c) 72%
(d) 100%
Ans: (b)
Explanation: Identify the bullish shares (those whose closing price exceeds opening price) and compute, for each such share, the percentage gain when bought at opening and sold at the day's high: percentage gain = (high - opening)/opening. Using the candlestick values shown:
C: Open 800 → High 1400 → Gain = (1400 - 800)/800 = 600/800 = 75%
D: Open 500 → High 1200 → Gain = (1200 - 500)/500 = 700/500 = 140%
G: Open 1200 → High 1900 → Gain = (1900 - 1200)/1200 = 700/1200 ≈ 58.33%
If equal money were invested across these shares, the weighted percentage would be different. The question asks for equal numbers of shares, so take the simple average of the individual percentage gains of all bullish shares. Using the gains computed above (and any other bullish share identified from the chart), the final average percentage gain for equal numbers of shares is given in the working diagram
and corresponds to option (b) 80%.

2021
Passage - 1
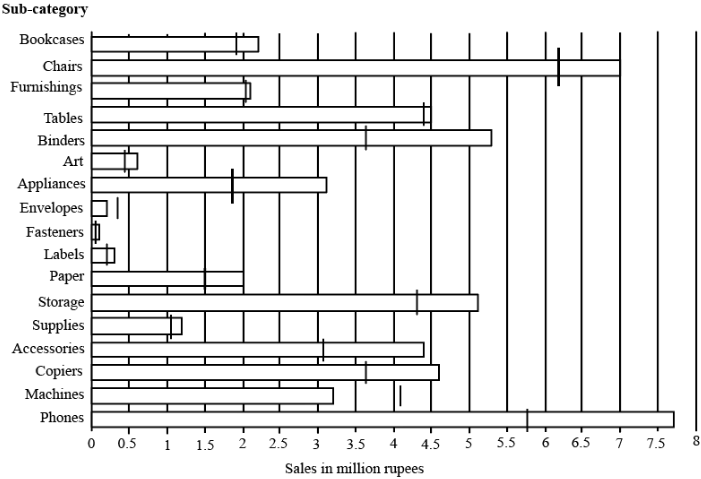
The horizontal bars in the above diagram represent 2020 aggregate sales (in ₹ million) of a company for the different subcategories of its products. The top four product subcategories (Bookcases, Chairs, Furnishings, Tables) belong to furniture product category; the bottom four product subcategories (Accessories, Copiers, Machines, Phones) belong to the technology product category while all other product subcategories belong to the office supply product category. For each of the product subcategories, there is a vertical line indicating the sales of the corresponding subcategory in 2019.
Q1: The total sales (in ₹ million) in 2019 from products in office supplies category is closest to
(a) 18.0
(b) 16.5
(c) 13.5
(d) 12.5
Ans: (b)
Explanation: Read the 2019 sales values (vertical lines) for each office-supplies subcategory and sum them. From the figure (2019, in ₹ mn, approx.):
Binders ≈ 5.0, Art ≈ 0.8, Appliances ≈ 3.0, Envelopes ≈ 0.3, Fasteners ≈ 0.1, Labels ≈ 0.2, Paper ≈ 1.5, Storage ≈ 4.4, Supplies ≈ 1.1.
Sum ≈ 5.0 + 0.8 + 3.0 + 0.3 + 0.1 + 0.2 + 1.5 + 4.4 + 1.1 = 16.4-16.5 million. The closest option is 16.5 million (b).
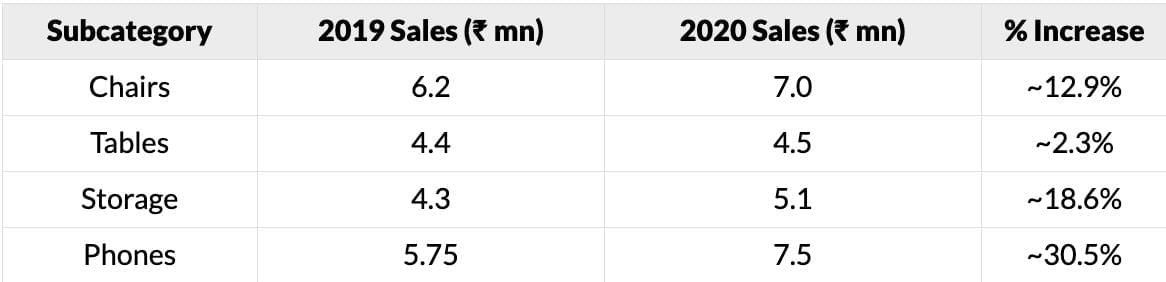
Q2: How many subcategories had sales of ₹ 4 million or more in 2019 and registered an increase in sales in excess of 25% in 2020?
Ans: 1
Sol: The number of subcategories had sales of ₹ 4 million or more in 2019 and registered an increase in sales in excess of 25% in 2020 :
The subcategories with more than 4 million in sales in 2019 are :Hence, only one subcategory satisfies the condition.
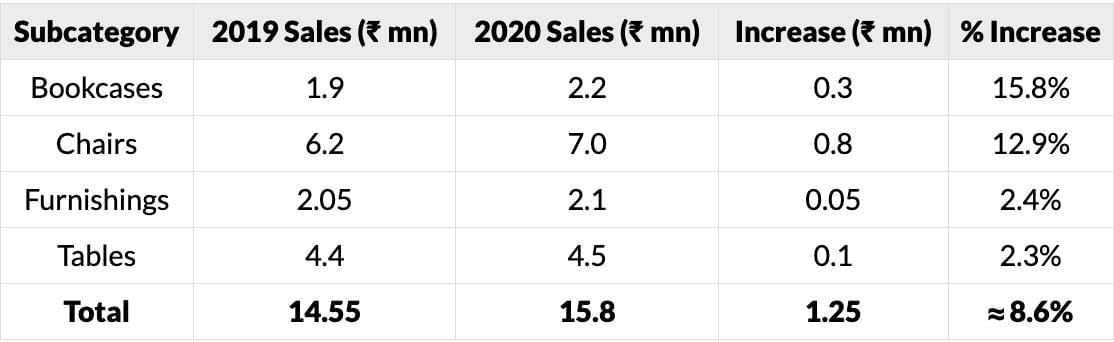
Q3: The percentage increase in sales in Furniture category from 2019 to 2020 is closest to
(a) 20%
(b) 8%
(c) 25%
(d) 1%
Ans: (b)
Explanation: Sum the 2019 sales for the four furniture subcategories (Bookcases, Chairs, Furnishings, Tables) and their 2020 sales (read from the bars). Using the totals from the diagram (shown in the working figures
and), compute percentage increase = (2020 total - 2019 total)/2019 total. The calculated value is closest to 8% (b).

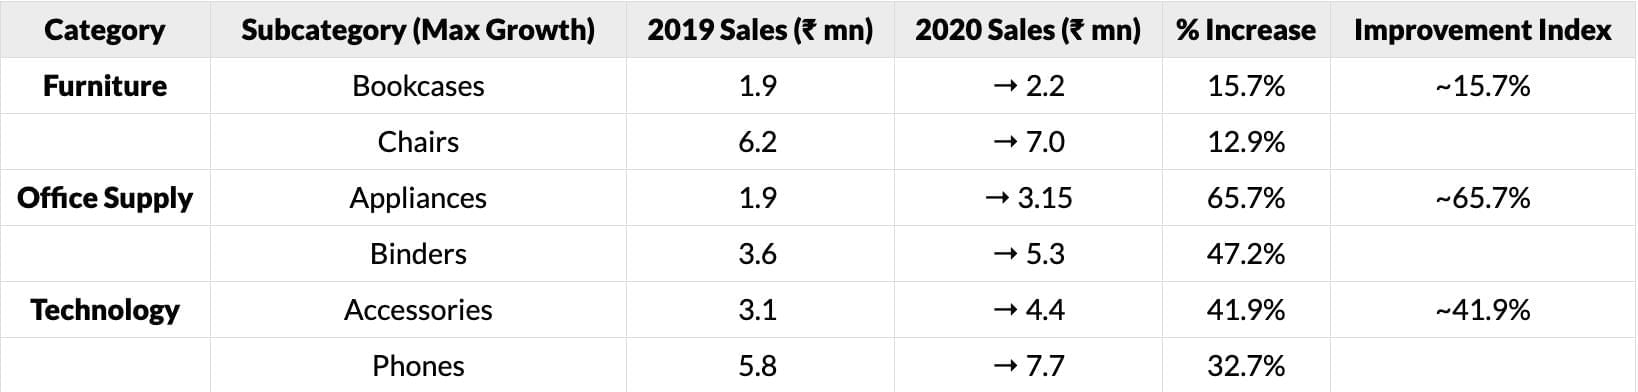
Q4: The improvement index for a category is the maximum percentage increase in sales from 2019 to 2020 among any of its subcategories. The correct order of categories in increasing order of this improvement index is
(a) furniture, technology, office supply
(b) 3technology, furniture, office supply
(c) office supply, technology, furniture
(d) office supply, furniture, technology
Ans: (a)
Explanation: For each product category, identify the subcategory that shows the largest percentage increase from 2019 to 2020. That percentage is the category's improvement index. From the visual data (working shown in
), the maximum percentage increases rank as: furniture < technology < office supply. Thus the increasing order is furniture, technology, office supply, so option (a) is correct.
Passage - 2
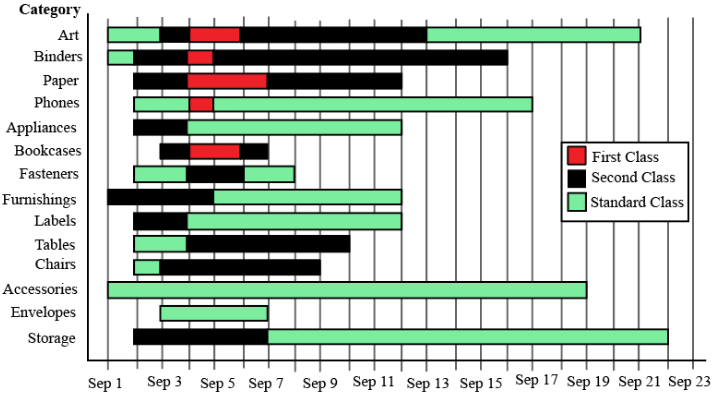
The different bars in the diagram above provide information about different orders in various categories (Art, Binders, ....) that were booked in the first two weeks of September of a store for one client. The colour and pattern of a bar denotes the ship mode (First Class / Second Class / Standard Class). The left end point of a bar indicates the booking day of the order, while the right end point indicates the dispatch day of the order. The difference between the dispatch day and the booking day (measured in terms of the number of days) is called the processing time of the order. For the same category, an order is considered for booking only after the previous order of the same category is dispatched. No two consecutive orders of the same category had identical ship mode during this period.
For example, there were only two orders in the furnishing category during this period. The first one was shipped in the Second Class. It was booked on Sep 1 and dispatched on Sep 5. The second order was shipped in the Standard class. It was booked on Sep 5 (although the order might have been placed before that) and dispatched on Sep 12. So the processing times were 4 and 7 days respectively for these orders.
Q1: How many days between Sep 1 and Sep 14 (both inclusive) had no booking from this client considering all the above categories?
Ans: 6
Explanation: Combine booking intervals across all categories to find days with no booking start. The accumulated booking table is shown in the working figure
. From that table, days with no new booking (Sep 1-14 inclusive) are: Sep 8, 9, 10, 11, 12 and 14. That yields a total of 6days without any booking.

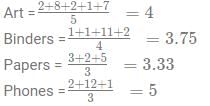
Q2: The sequence of categories -- Art, Binders, Paper and Phones -- in decreasing order of average processing time of their orders in this period is:
(a) Art, Binders, Paper, Phones
(b) Phones, Art, Binders, Paper
(c) Phones, Binders, Art, Paper
(d) Paper, Binders, Art, Phones
Ans: (b)
Explanation: From the accumulated data table (working shown in
), compute the processing time for each order and then the average processing time per order for each category. The summary of average processing times is shown in. Ranking them in decreasing order gives Phones, Art, Binders, Paper, so option (b) is correct.
Q3: What was the average processing time of all orders in the categories which had only one type of ship mode?
Ans: 11
Explanation: Find categories that used only one ship mode during the period. From the accumulated data table (working in
), Envelopes and Accessories each used only Standard class. Processing time for Envelopes = 7 - 3 = 4 days; Accessories = 19 - 1 = 18 days. Average = (4 + 18)/2 = 11 days. Hence the answer is 11.

Q4: Approximately what percentage of orders had a processing time of one day during the period Sep 1 to Sep 22 (both dates inclusive)?
(a) 22%
(b) 16%
(c) 20%
(d) 25%
Ans: (c)
Explanation: From the full order table (working in
), total orders during Sep 1-22 are 35. Count orders with processing time = 1 day; there are 7 such orders (listed in the working: Arts Standard, Binders First and Standard, Phones First, Bookcases second class - 2 orders - and Chairs standard). Percentage = (7/35) × 100 = 20%. Hence option (c) 20%is correct.

Passage - 3
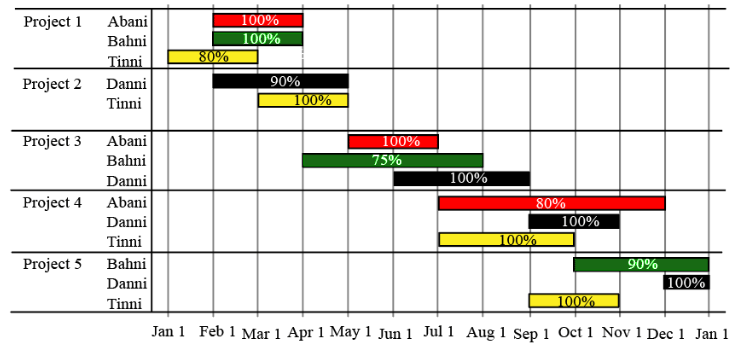
The figure above shows the schedule of four employees - Abani, Bahni, Danni, and Tinni - whom Dhoni supervised in 2020. Altogether there were five projects which started and concluded in 2020 in which they were involved. For each of these projects and for each employee, the starting day was at the beginning of a month and the concluding day was the end of a month, and these are indicated by the left and right end points of the corresponding horizontal bars. The number within each bar indicates the percentage of assigned work completed by the employee for that project, as assessed by Dhoni.
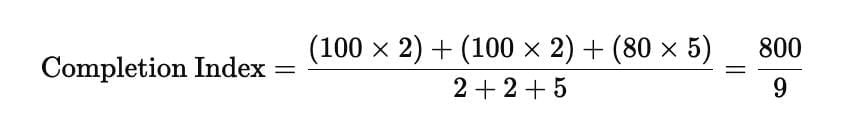
For each employee, his/her total project-month (in 2020) is the sum of the number of months (s)he worked across the five projects, while his/her annual completion index is the weightage average of the completion percentage assigned from the different projects, with the weights being the corresponding number of months (s)he worked in these projects. For each project, the total employee-month is the sum of the number of months four employees worked in this project, while its completion index is the weightage average of the completion percentage assigned for the employees who worked in this project, with the weights being the corresponding number of months they worked in this project.
Q5: The list of employees in decreasing order of annual completion index is:
(a) Danni, Tinni, Bahni, Abani
(b) Bahni, Abani, Tinni, Danni
(c) Danni, Tinni, Abani, Bahni
(d) Tinni, Danni, Abani, Bahni
Ans: (c)
Explanation: Compute each employee's annual completion index as the weighted average of the completion percentages, weights being months worked on the respective projects. The working figures for each employee are shown in
to. Using those calculations, the descending order of annual completion index is Danni, Tinni, Abani, Bahni, so option (c) is correct.

Q6: Which employees did not work in multiple projects for any of the months in 2020?
(a) Only Abani, Bahni and Danni
(b) Only Abani and Bahni
(c) All four of them
(d) Only Tinni
Ans: (a)
Explanation: Inspect the schedules: Abani, Bahni and Danni never overlap on two projects in the same month - they always work on at most one project in any month. Tinni, however, worked on multiple projects in September (projects 4 and 5). Thus only Abani, Bahni and Danni meet the condition (option a).
Q7: Which of the following statements is/are true?
I: The total project-month was the same for the four employees.
II: The total employee-month was the same for the five projects.
(a) Only II
(b) Both I and II
(c) Neither I nor II
(d) Only I
Ans: (d)
Explanation: Total project-month per employee is the sum of months each employee worked across projects. From the schedule:
Abani: 2 + 2 + 5 = 9 months
Bahni: 2 + 4 + 3 = 9 months
Danni: 3 + 3 + 2 + 1 = 9 months
Tinni: 2 + 2 + 3 + 2 = 9 months
All four employees have equal total project-months (9). So statement I is true.
For statement II, total employee-month for each project (sum of months worked by all employees on that project) are not all equal (project totals: 6, 5, 9, 10, 6). Hence statement II is false. Therefore only I is true (option d).
Q8: The project duration, measured in terms of the number of months, is the time during which at least one employee worked in the project. Which of the following pairs of the projects had the same duration?
(a) Project 1, Project 5
(b) Project 4, Project 5
(c) Project 3, Project 5
(d) Project 3, Project 4
Ans: (d)
Explanation: Determine project durations by looking at the months from the earliest start to the latest end month during which at least one employee worked on the project. From the schedule (worked out in the solution), project durations are:
Project 1: 3 months
Project 2: 3 months
Project 3: 5 months
Project 4: 5 months
Project 5: 4 months
Thus projects 3 and 4 have the same duration (5 months). Option (d) is correct.
The document CAT Previous Year Questions: Bar Graphs is a part of the CAT Course Logical Reasoning (LR) & Data Interpretation (DI).
All you need of CAT at this link: CAT
FAQs on CAT Previous Year Questions: Bar Graphs
| 1. How to interpret a bar graph? |  |
Ans. To interpret a bar graph, look at the length of each bar, which represents the value of a category or group. The taller the bar, the greater the value. Compare the lengths of the bars to see which category has the highest or lowest value.
| 2. What is the purpose of using a bar graph? | |
Ans. The purpose of using a bar graph is to visually represent data in a way that is easy to understand and interpret. Bar graphs make it simple to compare different categories or groups and identify trends or patterns in the data.
| 3. How to create a bar graph from given data? | |
Ans. To create a bar graph from given data, first determine the categories or groups you want to represent on the graph. Then, draw a horizontal and vertical axis, labeling the categories on the horizontal axis and the values on the vertical axis. Finally, draw bars corresponding to each category's value.
| 4. What are the different types of bar graphs? | |
Ans. Some common types of bar graphs include vertical bar graphs, horizontal bar graphs, stacked bar graphs, and grouped bar graphs. Each type is used to represent different types of data or comparisons.
| 5. How can a bar graph help in making data-driven decisions? | |
Ans. A bar graph can help in making data-driven decisions by providing a visual representation of data that makes it easy to compare different categories or groups. This comparison can help identify trends, patterns, or outliers in the data, leading to more informed decision-making.
About this Document

2.5K Views

4.94/5 Rating

Apr 19, 2026 Last updated
Document Description: CAT Previous Year Questions: Bar Graphs for CAT 2026 is part of Logical Reasoning (LR) & Data Interpretation (DI) preparation. The notes and questions for CAT Previous Year Questions: Bar Graphs have been prepared according to the CAT exam syllabus. Information about CAT Previous Year Questions: Bar Graphs covers topics like and CAT Previous Year Questions: Bar Graphs Example, for CAT 2026 Exam. Find important definitions, questions, notes, meanings, examples, exercises and tests below for CAT Previous Year Questions: Bar Graphs.
Introduction of CAT Previous Year Questions: Bar Graphs in English is available as part of our Logical Reasoning (LR) & Data Interpretation (DI) for CAT & CAT Previous Year Questions: Bar Graphs in Hindi for Logical Reasoning (LR) & Data Interpretation (DI) course. Download more important topics related with notes, lectures and mock test series for CAT Exam by signing up for free. CAT: CAT Previous Year Questions: Bar Graphs
Description
CAT Previous Year Questions: Bar Graphs of Logical Reasoning is important for the exam. Get access to all the questions with solutions asked in past years of CAT exam. Download it from EduRev.
Information about CAT Previous Year Questions: Bar Graphs
In this doc you can find the meaning of CAT Previous Year Questions: Bar Graphs defined & explained in the simplest way possible. Besides explaining types of CAT Previous Year Questions: Bar Graphs theory, EduRev gives you an ample number of questions to practice CAT Previous Year Questions: Bar Graphs tests, examples and also practice CAT tests


Related Searches
Objective type Questions, shortcuts and tricks, MCQs, mock tests for examination, CAT Previous Year Questions: Bar Graphs, Exam, Previous Year Questions with Solutions, video lectures, Sample Paper, past year papers, pdf , Viva Questions, Important questions, practice quizzes, Semester Notes, Extra Questions, Free, CAT Previous Year Questions: Bar Graphs, CAT Previous Year Questions: Bar Graphs, Summary, study material, ppt;