Lissajous Pattern | Electrical and Electronic Measurements - Electrical Engineering (EE) PDF Download
Definition: Lissajous figure
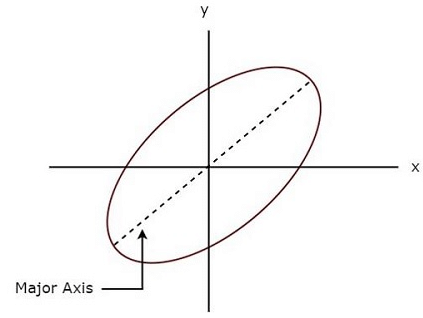
Lissajous figure is the pattern which is displayed on the screen, when sinusoidal signals are applied to both horizontal & vertical deflection plates of CRO. These patterns will vary based on the amplitudes, frequencies and phase differences of the sinusoidal signals, which are applied to both horizontal & vertical deflection plates of CRO.The following figure shows an example of Lissajous figure.

The above Lissajous figure is in elliptical shape and its major axis has some inclination angle with positive x-axis.
Measurements using Lissajous Figures
We can do the following two measurements from a Lissajous figure.- Frequency of the sinusoidal signal
- Phase difference between two sinusoidal signals
Now, let us discuss about these two measurements one by one.
Measurement of Frequency
Lissajous figure will be displayed on the screen, when the sinusoidal signals are applied to both horizontal & vertical deflection plates of CRO. Hence, apply the sinusoidal signal, which has standard known frequency to the horizontal deflection plates of CRO. Similarly, apply the sinusoidal signal, whose frequency is unknown to the vertical deflection plates of CROLet, fH and fV are the frequencies of sinusoidal signals, which are applied to the horizontal & vertical deflection plates of CRO respectively. The relationship between fH and fV can be mathematically represented as below.

From above relation, we will get the frequency of sinusoidal signal, which is applied to the vertical deflection plates of CRO as

Where,
nH is the number of horizontal tangencies
nV is the number of vertical tangencies
We can find the values of nH and nV from Lissajous figure. So, by substituting the values of nH, nV and fH in Equation 1, we will get the value of fV, i.e. the frequency of sinusoidal signal that is applied to the vertical deflection plates of CRO.
 |
Download the notes
Lissajous Pattern
|
Download as PDF |
Measurement of Phase Difference
A Lissajous figure is displayed on the screen when sinusoidal signals are applied to both horizontal & vertical deflection plates of CRO. Hence, apply the sinusoidal signals, which have same amplitude and frequency to both horizontal and vertical deflection plates of CRO.For few Lissajous figures based on their shape, we can directly tell the phase difference between the two sinusoidal signals.
- If the Lissajous figure is a straight line with an inclination of 45∘ with positive x-axis, then the phase difference between the two sinusoidal signals will be 0∘. That means, there is no phase difference between those two sinusoidal signals.
If the Lissajous figure is a straight line with an inclination of 135∘ with positive x-axis, then the phase difference between the two sinusoidal signals will be 180∘. That means, those two sinusoidal signals are out of phase. - If the Lissajous figure is in circular shape, then the phase difference between the two sinusoidal signals will be 90∘ or 270∘.
We can calculate the phase difference between the two sinusoidal signals by using formulae, when the Lissajous figures are of elliptical shape.
- If the major axis of an elliptical shape Lissajous figure having an inclination angle lies between 0∘ and 90∘ with positive x-axis, then the phase difference between the two sinusoidal signals will be.

- If the major axis of an elliptical shape Lissajous figure having an inclination angle lies between 90∘ and 180∘ with positive x-axis, then the phase difference between the two sinusoidal signals will be.

Where,
- x1 is the distance from the origin to the point on x-axis, where the elliptical shape Lissajous figure intersects
- x2 is the distance from the origin to the vertical tangent of elliptical shape Lissajous figure
- y1 is the distance from the origin to the point on y-axis, where the elliptical shape Lissajous figure intersects
- y2 is the distance from the origin to the horizontal tangent of elliptical shape Lissajous figure
- In this chapter, welearnt how to find the frequency of unknown sinusoidal signal and the phase difference between two sinusoidal signals from Lissajous figures by using formulae.
|
48 videos|39 docs|22 tests
|


