Systematic and Random Errors | Physics for Grade 12 PDF Download
In scientific research, measurement error is the difference between an observed value and the true value of something. It’s also called observation error or experimental error.
There are two main types of measurement error:
- Random error is a chance difference between the observed and true values of something (e.g., a researcher misreading a weighing scale records an incorrect measurement).
- Systematic error is a consistent or proportional difference between the observed and true values of something (e.g., a miscalibrated scale consistently registers weights as higher than they actually are).
By recognizing the sources of error, you can reduce their impacts and record accurate and precise measurements.
Are random or systematic errors worse?
In research, systematic errors are generally a bigger problem than random errors. Random error isn’t necessarily a mistake, but rather a natural part of measurement. There is always some variability in measurements, even when you measure the same thing repeatedly, because of fluctuations in the environment, the instrument, or your own interpretations. But variability can be a problem when it affects your ability to draw valid conclusions about relationships between variables. This is more likely to occur as a result of systematic error.
Precision vs accuracy
- Random error mainly affects precision, which is how reproducible the same measurement is under equivalent circumstances. In contrast, systematic error affects the accuracy of a measurement, or how close the observed value is to the true value.
- Taking measurements is similar to hitting a central target on a dartboard. For accurate measurements, you aim to get your dart (your observations) as close to the target (the true values) as you possibly can. For precise measurements, you aim to get repeated observations as close to each other as possible.
- Random error introduces variability between different measurements of the same thing, while systematic error skews your measurement away from the true value in a specific direction.
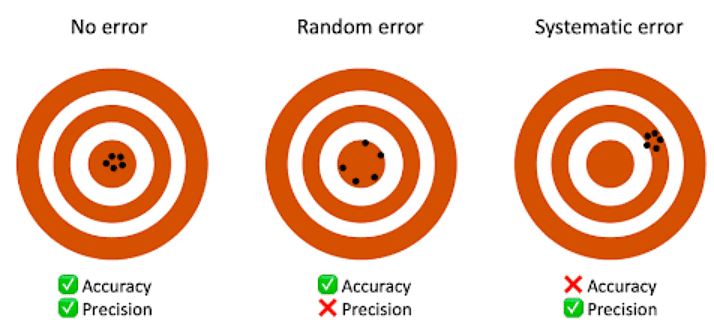
- When you only have random error, if you measure the same thing multiple times, your measurements will tend to cluster or vary around the true value. Some values will be higher than the true score, while others will be lower. When you average out these measurements, you’ll get very close to the true score.
- For this reason, random error isn’t considered a big problem when you’re collecting data from a large sample—the errors in different directions will cancel each other out when you calculate descriptive statistics. But it could affect the precision of your dataset when you have a small sample.
- Systematic errors are much more problematic than random errors because they can skew your data to lead you to false conclusions. If you have systematic error, your measurements will be biased away from the true values. Ultimately, you might make a false positive or a false negative conclusion (a Type I or II error) about the relationship between the variables you’re studying.
Random error
Random error affects your measurements in unpredictable ways: your measurements are equally likely to be higher or lower than the true values.
In the graph below, the black line represents a perfect match between the true scores and observed scores of a scale. In an ideal world, all of your data would fall on exactly that line. The green dots represent the actual observed scores for each measurement with random error added.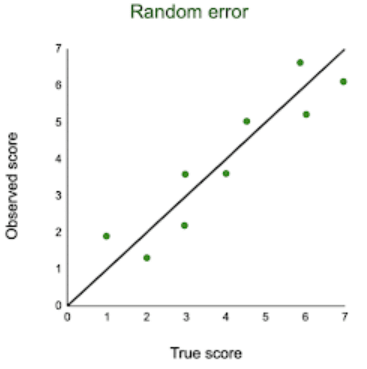 Random error is referred to as “noise”, because it blurs the true value (or the “signal”) of what’s being measured. Keeping random error low helps you collect precise data.

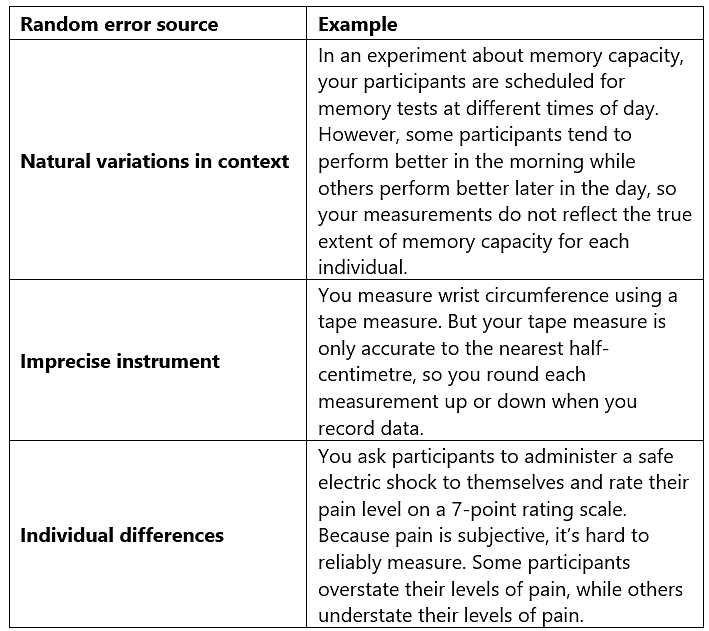
Sources of random errors
Some common sources of random error include:
- natural variations in real world or experimental contexts.
- imprecise or unreliable measurement instruments.
- individual differences between participants or units.
- poorly controlled experimental procedures.
 Reducing Random Error
Random error is almost always present in research, even in highly controlled settings. While you can’t eradicate it completely, you can reduce random error using the following methods.
- Take repeated measurements
- A simple way to increase precision is by taking repeated measurements and using their average. For example, you might measure the wrist circumference of a participant three times and get slightly different lengths each time. Taking the mean of the three measurements, instead of using just one, brings you much closer to the true value.
- Increase your sample size
- Large samples have less random error than small samples. That’s because the errors in different directions cancel each other out more efficiently when you have more data points. Collecting data from a large sample increases precision and statistical power.
- Control variables
- In controlled experiments, you should carefully control any extraneous variables that could impact your measurements. These should be controlled for all participants so that you remove key sources of random error across the board.
Systematic Error
Systematic error means that your measurements of the same thing will vary in predictable ways: every measurement will differ from the true measurement in the same direction, and even by the same amount in some cases.
Systematic error is also referred to as bias because your data is skewed in standardized ways that hide the true values. This may lead to inaccurate conclusions.
Types of systematic errors
Offset errors and scale factor errors are two quantifiable types of systematic error. An offset error occurs when a scale isn’t calibrated to a correct zero point. It’s also called an additive error or a zero-setting error.
Example: Offset error
When measuring participants’ wrist circumferences, you misread the “2” on the measuring tape as a zero-point. All of your measurements have an extra 2 centimeters added to them.
A scale factor error is when measurements consistently differ from the true value proportionally (e.g. by 10%). It’s also referred to as a correlational systematic error or a multiplier error.
Example: Scale factor error
A weighing scale consistently adds 10% to each weight. A true weight of 10 kg is recorded as 11 kg, while a true weight of 40 kg is recorded as 44 kg.
You can plot offset errors and scale factor errors in graphs to identify their differences. In the graphs below, the black line shows when your observed value is the exact true value, and there is no random error.
The blue line is an offset error: it shifts all of your observed values upwards or downwards by a fixed amount (here, it’s one additional unit).
The pink line is a scale factor error: all of your observed values are multiplied by a factor—all values are shifted in the same direction by the same proportion, but by different absolute amounts.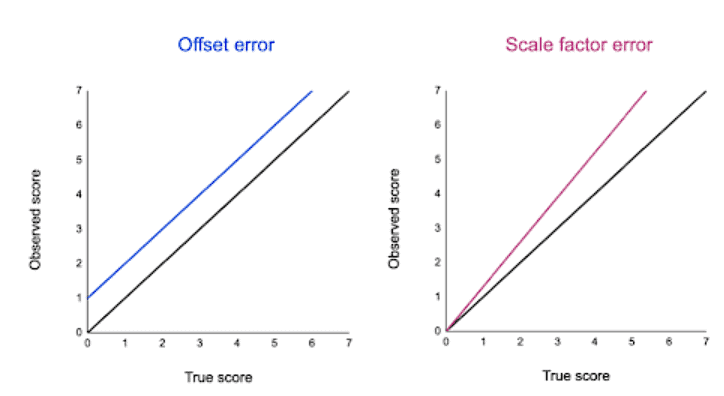
 |
Download the notes
Systematic and Random Errors
|
Download as PDF |
Sources of Systematic Errors
The sources of systematic error can range from your research materials to your data collection procedures and to your analysis techniques. This isn’t an exhaustive list of systematic error sources, because they can come from all aspects of research.
Response bias occurs when your research materials (e.g., questionnaires) prompt participants to answer or act in inauthentic ways through leading questions. For example, social desirability bias can lead participants try to conform to societal norms, even if that’s not how they truly feel.
Example: Leading question
In a survey, you ask participants for their opinions on climate change actions.
Your question states: “Experts believe that only systematic actions can reduce the effects of climate change. Do you agree that individual actions are pointless?”
By citing “expert opinions,” this type of loaded question signals to participants that they should agree with the opinion or risk seeming ignorant. Participants may reluctantly respond that they agree with the statement even when they don’t.
Experimenter drift occurs when observers become fatigued, bored, or less motivated after long periods of data collection or coding, and they slowly depart from using standardized procedures in identifiable ways.
Example: Experimenter (observer) drift
You’re qualitatively coding videos from social experiments to note any cooperative actions or behaviors between participants.
Initially, you code all subtle and obvious behaviors that fit your criteria as cooperative. But after spending days on this task, you only code extremely obviously helpful actions as cooperative.
You gradually move away from the original standard criteria for coding data, and your measurements become less reliable.
Sampling bias occurs when some members of a population are more likely to be included in your study than others. It reduces the generalizability of your findings, because your sample isn’t representative of the whole population.
 |
Take a Practice Test
Test yourself on topics from Grade 12 exam
|
Practice Now |
Reducing Systematic Error
You can reduce systematic errors by implementing these methods in your study.
Triangulation
Triangulation means using multiple techniques to record observations so that you’re not relying on only one instrument or method.
For example, if you’re measuring stress levels, you can use survey responses, physiological recordings, and reaction times as indicators. You can check whether all three of these measurements converge or overlap to make sure that your results don’t depend on the exact instrument used.
Regular calibration
Calibrating an instrument means comparing what the instrument records with the true value of a known, standard quantity. Regularly calibrating your instrument with an accurate reference helps reduce the likelihood of systematic errors affecting your study.
You can also calibrate observers or researchers in terms of how they code or record data. Use standard protocols and routine checks to avoid experimenter drift.
Randomization
Random sampling methods help ensure that your sample doesn’t systematically differ from the population.
In addition, if you’re doing an experiment, use random assignment to place participants into different treatment conditions. This helps counter bias by balancing participant characteristics across groups.
Masking
Wherever possible, you should hide the condition assignment from participants and researchers through masking (blinding).
Participants’ behaviors or responses can be influenced by experimenter expectancies and demand characteristics in the environment, so controlling these will help you reduce systematic bias.
|
143 videos|360 docs|145 tests
|


practice quizzes
,Viva Questions
,Previous Year Questions with Solutions
,Important questions
,MCQs
,ppt
,mock tests for examination
,Semester Notes
,Free
,Systematic and Random Errors | Physics for Grade 12
,Sample Paper
,study material
,Systematic and Random Errors | Physics for Grade 12
,Objective type Questions
,past year papers
,Systematic and Random Errors | Physics for Grade 12
,Summary
,Exam
,video lectures
,shortcuts and tricks
,Extra Questions
;


Systematic and Random Errors Free PDF Download
Importance of Systematic and Random Errors
Systematic and Random Errors Notes
Systematic and Random Errors Grade 12 Questions
Study Systematic and Random Errors on the App
|
© EduRev
|
Education Revolution
|


|


