Vertical Line Test

How to Use the Vertical Line Test to Determine if a Relation is a Function
Relation is a set of ordered pairs. Additionally, we learned that a function is a special relation in which each x-value is associated with one and only one y-value. Suppose we had the following relation:
- {(0,3), (2,5), (4,2), (6,3)}
Does this relation represent a function? Yes, since each x-value is associated with one and only one y-value.
- 0 » 3 - an x-value of 0 is associated with a y-value of 3
- 2 » 5 - an x-value of 2 is associated with a y-value of 5
- 4 » 2 - an x-value of 4 is associated with a y-value of 2
- 6 » 3 - an x-value of 6 is associated with a y-value of 3
In some cases, an illustration will make things more clear: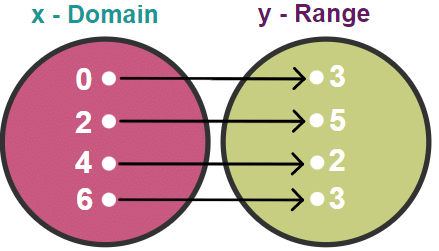
Another way to determine if a relation is a function is with the use of a graph. If we plot each ordered pair on the coordinate plane, no vertical line should intersect more than one ordered pair. This test is known as the "vertical line test".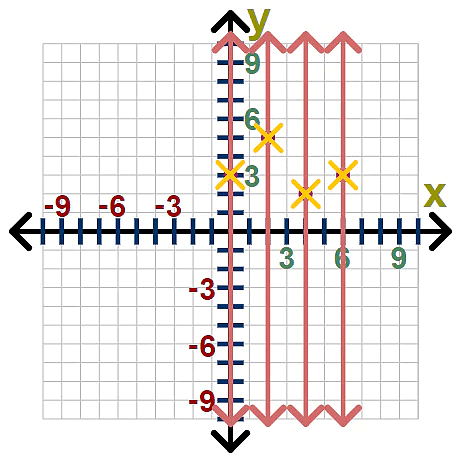
Let's look at another example.
- {(2,-7), (4,1), (2,3), (-1,-5)}
Does this relation represent a function? No, since an x-value of 2 is associated with more than one y-value: -7 and 3.
2 » -7 and 3 - an x-value of 2 is associated with a y-value of -7 and 3
4 » 1 - an x-value of 4 is associated with a y-value of 1
-1 » -5 - an x-value of -1 is associated with a y-value of -5
Let's again look at an illustration: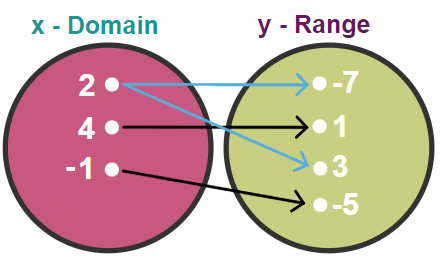 We can also see this relation is not a function with the use of our vertical line test:
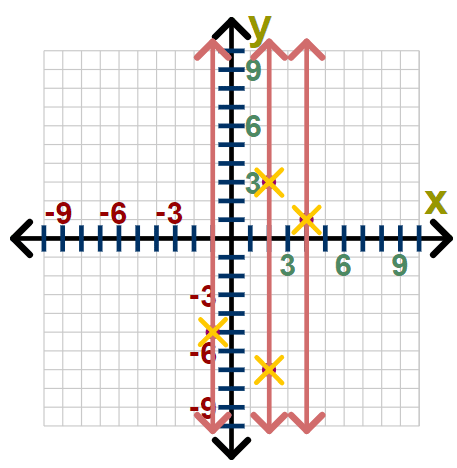 We can see from the graph above that our vertical line x = 2, intersects more than one ordered pair: (2,3) and (2,-7). This tells us that the x-value of 2 is associated with more than one y-value. When this occurs, we know our relation is not a function.
In most cases, we will not be dealing with a simple set of four or five ordered pairs. These are easy examples designed to help one understand the concept of a function. What happens if we see an equation such as:
- y = 3x + 5
Let's think about a few things here. First and foremost, let's think about the domain and range. We know the domain is the set of allowable x-values. Ask yourself the question, is there any restriction on what can be plugged in for x? No, so the domain will be all real numbers.
- domain: {x |x ∈ ℝ}
The above is read as "the set of all x such that x is a real number".
What about our range? Think about y as an output. We plug in a value for x, multiply by 3 and add 5. Since we can plug in anything we want for x, our input, y can also be any real number. We can make y as big as we would like by increasing the size of x. We can make y as small as we would like by decreasing the size of x.
- range: {y | y ∈ ℝ}
The above is read as "the set of all y such that y is a real number".
Is this relation a function? To determine this, let's graph our equation and use the vertical line test.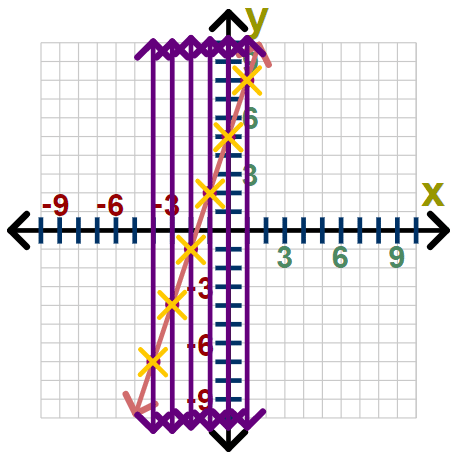 It is clear that no vertical line will ever impact the graph in more than one location. This means that each x-value is associated with one and only one y-value.
Our relation: y = 3x + 5 is a function.
Let's look at a few examples.
Example 1: Determine if the graph of the relation represents a function, state the domain and the range.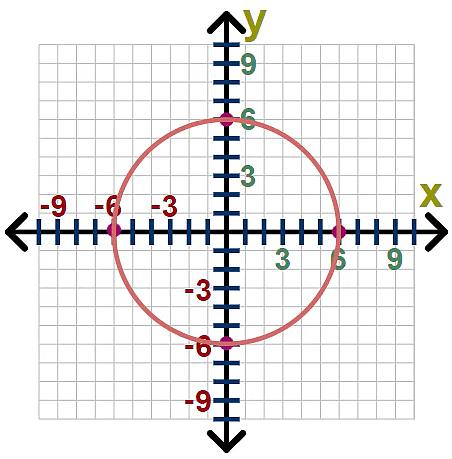
We can use the vertical line test to determine if we have a function.
Since we can draw a vertical line and impact the graph in more than one location, this is not the graph of a function.
The domain can be found from the graph. We can see that the smallest x-value is -6 and the largest is 6.
domain: {x | -6 ≤ x ≤ 6}
Similarly, we can find the range from the graph. We can also see the smallest y-value is -6 and the largest is 6.
range: {y | -6 ≤ y ≤ 6}
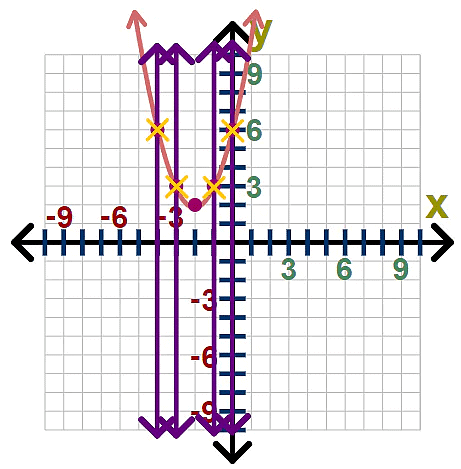
Example 2: Determine if the graph of the relation represents a function, state the domain and the range.
We can use the vertical line test to determine if we have a function.
It is clear that no vertical line will ever impact the graph in more than one location. This means that each x-value is associated with one and only one y-value. This is the graph of a function.
The domain and range can both be found from our graph. We can see there is no limit on x-values. Essentially, the domain will contain all real numbers. The range, however, is limited. From the graph, we can see the smallest value for y is 2. Therefore, our range will consist of all real numbers that are greater than or equal to 2.
- domain: {x |x ∈ ℝ}
- range: {y | y ≥ 2}
More on Domain
Now that we have a good understanding of how to determine if a relation is a function, let's think a little bit more about the domain of a function. The domain of a function is the set of allowable x-values. There are a few things to watch out for:
- We can't divide by zero
- We can't take the square root of a negative number and get a real number
- When we square a number, the result is non-negative
Example 3: Find the domain for each.
y = 1/x-9
Since we are not allowed to divide by zero, think about the denominator here:
x - 9
We can set this equal to zero and solve:
x - 9 = 0
x = 9
This means x can't be 9. If we let x be 9, our denominator will be zero, and division by zero is not defined.
- domain: {x | x ≠ 9}
Example 4: Find the domain for each.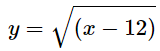
Since we can only take the square root of a non-negative number and end up with a real number, we think about what is under the square root symbol:
x - 12
We know that whatever is plugged in for x, the result of subtracting away 12 has to be 0 or larger:
x - 12 ≥ 0
x ≥ 12
This means x can be 12 or any larger value. If we plug in a value that is less than 12, we end up with the square root of a negative.
- domain: {x | x ≥ 12}


