Grade 12 Exam > Grade 12 Notes > Economics for Grade 12 > PPC and Economic Growth
PPC and Economic Growth | Economics for Grade 12 PDF Download

Production Possibility Curves (PPC)
- The Production Possibility Curve (PPC) is an economic model that considers the maximum possible production (output) that a country can generate if it uses all of its factors of production to produce only two goods/services
- Any two goods/services can be used to demonstrate this model
- Many PPC diagrams show capital goods & consumer goods on the axes
- Capital goods are assets that help a firm or nation to produce output (manufacturing). For example, a robotic arm in a car manufacturing company is a capital good
- Consumer goods are end products & have no future productive use. For example, a watch
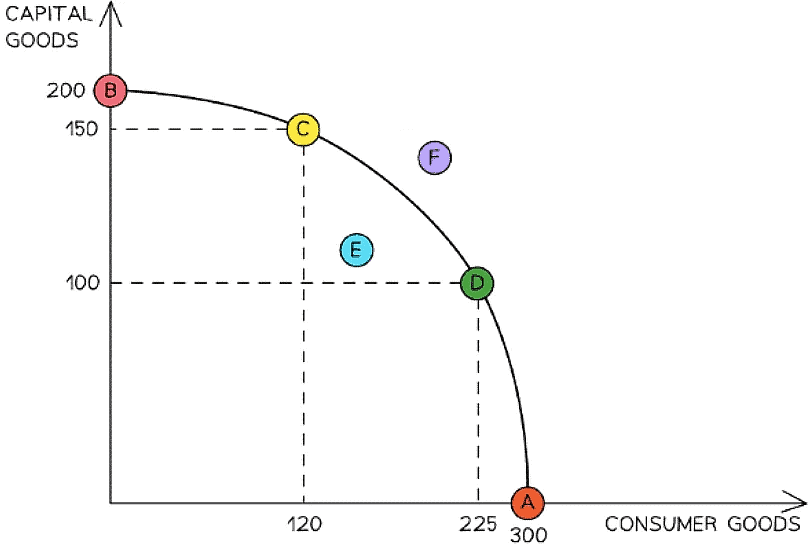
A PPC for an economy demonstrating the use of its resources to produce capital or consumer goods
Diagram Explanation
- The use of PPC to depict the maximum productive potential of an economy
- The curve demonstrates the possible combinations of the maximum output this economy can produce using all of its resources (factors of production)
- At A, its resources are used to produce only consumer goods (300)
- At B, its resources are used to produce only capital goods (200)
- Points C & D both represent full (efficient) use of an economy's resources as these points fall on the curve. At C, 150 capital goods and 120 consumer goods are produced
- The use of PPC to depict opportunity cost
- To produce one more unit of capital goods, this economy must give up production of some units of consumer goods (limited resources)
- If this economy moves from point C (120, 150) to D (225, 100), the opportunity cost of producing an additional 105 units of consumer goods is 50 capital goods
- A movement in the PPC occurs when there is any change in the allocation of existing resources within an economy such as the movement from point C to D
- The use of PPC to depict efficiency, inefficiency, attainable and unattainable production
- Producing at any point on the curve represents productive efficiency
- Any point inside the curve represents inefficiency (point E)
- Using the current level of resources available, attainable production is any point on or inside the curve and any point outside the curve is unattainable (point F)
Shifts in a PPC
- As opposed to a movement along the PPC described above, the entire PPC of an economy can shift inwards or outwards
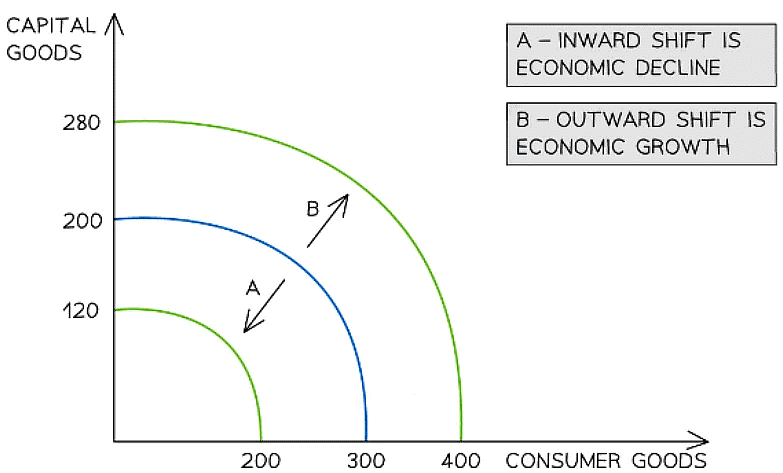
Outward shifts of a PPC show economic growth & inward shifts show economic decline
Diagram Explanation
- Economic growth occurs when there is an increase in the productive potential of an economy
- This is demonstrated by an outward shift of the entire curve. More consumer goods and more capital goods can now be produced using all of the available resources
- This shift is caused by an increase in the quality or quantity of the available factors of production
- One example of how the quality of a factor of production can be improved is through the impact of training and education on labour. An educated workforce is a more productive workforce and the production possibilities increase
- One example of how the quantity of a factor of production can be increased is through a change in migration policies. If an economy allows more foreign workers to work productively in the economy, then the production possibilities increase
- Economic decline occurs when there is any impact on an economy that reduces the quantity or quality of the available factors of production
- One example of how this may happen is to consider how the Japanese tsunami of 2011 devastated the production possibilities of Japan for many years. It shifted their PPC inwards and resulted in economic decline
The document PPC and Economic Growth | Economics for Grade 12 is a part of the Grade 12 Course Economics for Grade 12.
All you need of Grade 12 at this link: Grade 12
|
23 videos|22 docs|1 tests
|
About this Document

Oct 11, 2025
Last updated
Related Exams
Document Description: PPC and Economic Growth for Grade 12 2025 is part of Economics for Grade 12 preparation.
The notes and questions for PPC and Economic Growth have been prepared according to the Grade 12 exam syllabus. Information about PPC and Economic Growth covers topics
like and PPC and Economic Growth Example, for Grade 12 2025 Exam. Find important definitions, questions, notes, meanings, examples, exercises and tests below for PPC and Economic Growth.
Introduction of PPC and Economic Growth in English is available as part of our Economics for Grade 12
for Grade 12 & PPC and Economic Growth in Hindi for Economics for Grade 12 course.
Download more important topics related with notes, lectures and mock test series for Grade 12
Exam by signing up for free. Grade 12: PPC and Economic Growth | Economics for Grade 12
Description
Full syllabus notes, lecture & questions for PPC and Economic Growth | Economics for Grade 12 - Grade 12 | Plus excerises question with solution to help you revise complete syllabus for Economics for Grade 12 | Best notes, free PDF download
Information about PPC and Economic Growth
In this doc you can find the meaning of PPC and Economic Growth defined & explained in the simplest way possible. Besides explaining types of
PPC and Economic Growth theory, EduRev gives you an ample number of questions to practice PPC and Economic Growth tests, examples and also practice Grade 12
tests

Related Searches
Summary
,Objective type Questions
,Important questions
,Viva Questions
,mock tests for examination
,Semester Notes
,video lectures
,Exam
,Previous Year Questions with Solutions
,practice quizzes
,PPC and Economic Growth | Economics for Grade 12
,PPC and Economic Growth | Economics for Grade 12
,study material
,ppt
,Sample Paper
,PPC and Economic Growth | Economics for Grade 12
,Extra Questions
,MCQs
,shortcuts and tricks
,past year papers
,Free
;


Additional Information about PPC and Economic Growth for Grade 12 Preparation
PPC and Economic Growth Free PDF Download
The PPC and Economic Growth is an invaluable resource that delves deep into the core of the Grade 12 exam.
These study notes are curated by experts and cover all the essential topics and concepts, making your preparation more efficient and effective.
With the help of these notes, you can grasp complex subjects quickly, revise important points easily,
and reinforce your understanding of key concepts. The study notes are presented in a concise and easy-to-understand manner,
allowing you to optimize your learning process. Whether you're looking for best-recommended books, sample papers, study material,
or toppers' notes, this PDF has got you covered. Download the PPC and Economic Growth now and kickstart your journey towards success in the Grade 12 exam.
Importance of PPC and Economic Growth
The importance of PPC and Economic Growth cannot be overstated, especially for Grade 12 aspirants.
This document holds the key to success in the Grade 12 exam.
It offers a detailed understanding of the concept, providing invaluable insights into the topic.
By knowing the concepts well in advance, students can plan their preparation effectively.
Utilize this indispensable guide for a well-rounded preparation and achieve your desired results.
PPC and Economic Growth Notes
PPC and Economic Growth Notes offer in-depth insights into the specific topic to help you master it with ease.
This comprehensive document covers all aspects related to PPC and Economic Growth.
It includes detailed information about the exam syllabus, recommended books, and study materials for a well-rounded preparation.
Practice papers and question papers enable you to assess your progress effectively.
Additionally, the paper analysis provides valuable tips for tackling the exam strategically.
Access to Toppers' notes gives you an edge in understanding complex concepts.
Whether you're a beginner or aiming for advanced proficiency, PPC and Economic Growth Notes on EduRev are your ultimate resource for success.
PPC and Economic Growth Grade 12 Questions
The "PPC and Economic Growth Grade 12 Questions" guide is a valuable resource for all aspiring students preparing for the
Grade 12 exam. It focuses on providing a wide range of practice questions to help students gauge
their understanding of the exam topics. These questions cover the entire syllabus, ensuring comprehensive preparation.
The guide includes previous years' question papers for students to familiarize themselves with the exam's format and difficulty level.
Additionally, it offers subject-specific question banks, allowing students to focus on weak areas and improve their performance.
Study PPC and Economic Growth on the App
Students of Grade 12 can study PPC and Economic Growth alongwith tests & analysis from the EduRev app,
which will help them while preparing for their exam. Apart from the PPC and Economic Growth,
students can also utilize the EduRev App for other study materials such as previous year question papers, syllabus, important questions, etc.
The EduRev App will make your learning easier as you can access it from anywhere you want.
The content of PPC and Economic Growth is prepared as per the latest Grade 12 syllabus.
|
© EduRev
|
Education Revolution
|


|


Signup on EduRev and stay on top of your study goals
10M+ students crushing their study goals daily