Banking Exams Exam > Banking Exams Notes > Radar Graphs
Radar Graphs - Banking Exams PDF Download

Introduction
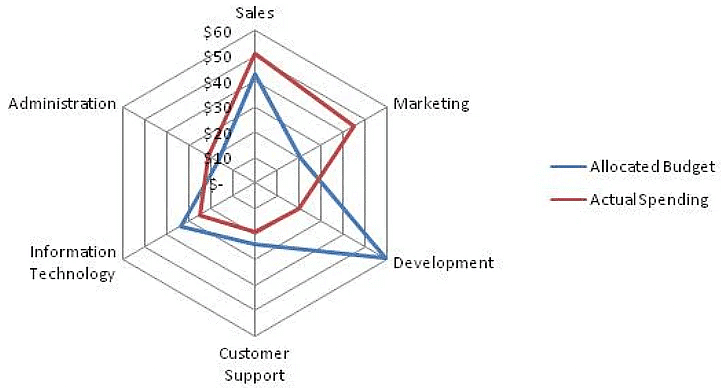
- Radar chart is a graphical way to compare data by displaying data in a "web-like" form looking like spider web. So it is also known as spider chart/graph. Usually, it is applied to evaluate multiple alternatives based on multiple criteria.
- Radar charts, sometimes known as spider, start or web charts, are a two-dimensional chart type designed to plot one or more series of values over multiple common quantitative variables by providing an axis for each variable, arranged radially as equi-angular spokes around a central point. The values for adjacent variables in a single series are connected by lines, and, frequently, the polygonal shape created by these lines in filled with a colour. Beyond this there are many subtle variations that have different consequences with respect to the efficacy of the chart.
- These variations will be covered at appropriate points in the following critique.
Benefits of Using Radar Charts
- They provide a very easy way to see if someone is competent or not.
- By overlaying multiple "webs" on a radar chart, you can do visual comparisons against reference data sets very easily. For example, you could compare a student to his classmates by overlaying the average radar chart from the entire class on top of his personal radar chart.
- They are great input in the development of learning plans
- Weaknesses or strengths in performance are easy to see on radar charts. When someone is far above or below a standard, you will be able to observe a clear "balloon out" or "cave in" pattern.
- This makes it easier for time-crunched advisors to find and address issues when they're working with students. It also makes it easy to identify performers who stand out from the crowd. Those top performers may be able to help others in areas they are particularly good at. What is more, it may highlight trainees who should spend more time in training to catch up with other.
Radar Charts for Problem Solving
- Radar charts are widely used in many fields, including education, business or other presentation. Here you can learn how to use a Radar Chart as a problem-solving technique, being especially useful in performance measurement. To solve a problem, sometimes you need to learn or analyze the problem comprehensively, through facts or figures. How can you dig out more useful information from the dry number? Radar chart is a great helper for you to make static data more meaningful and useful. It helps you compare and clarify so that you can see the differences and deficiencies. See how you can solve problems by radar chart through one real case.
Problem Solving Example: Performance Evaluation Radar Chart
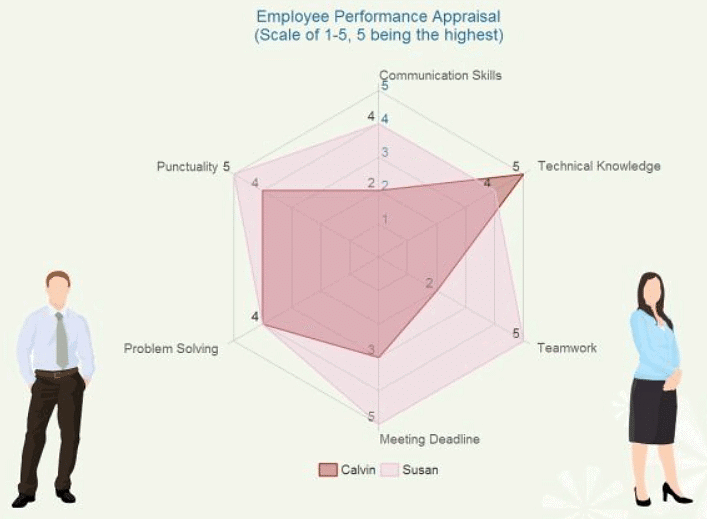
For this example, possible analyses might include:
- Susan is better in punctuality, communication skills teamwork and meeting deadline.
- Calvin's technical knowledge is better than Susan.
- The largest difference is found in teamwork.
- Susan's performance is better as a whole.
- Calvin ought to improve his soft skills to be more competent.
The document Radar Graphs - Banking Exams is a part of Banking Exams category.
All you need of Banking Exams at this link: Banking Exams
About this Document

4.87/5
Rating

Oct 17, 2025
Last updated
Related Exams
Document Description: Radar Graphs for Banking Exams 2025 is part of Banking Exams preparation. The notes and questions for Radar Graphs have been prepared according to the Banking Exams exam syllabus. Information about Radar Graphs covers topics like Introduction and Radar Graphs Example, for Banking Exams 2025 Exam. Find important definitions, questions, notes, meanings, examples, exercises and tests below for Radar Graphs.
Introduction of Radar Graphs in English is available as part of
our Banking Exams preparation & Radar Graphs in Hindi for Banking Exams
courses. Download more important topics, notes, lectures and mock test series for Banking Exams
Exam by signing up for free. Banking Exams: Radar Graphs - Banking Exams
Description
Full syllabus notes, lecture & questions for Radar Graphs - Banking Exams - Banking Exams | Plus excerises question with solution to help you revise complete syllabus | Best notes, free PDF download
Information about Radar Graphs
In this doc you can find the meaning of Radar Graphs defined & explained in the simplest way possible.
Besides explaining types of Radar Graphs theory,
EduRev gives you an ample number of questions to practice Radar Graphs tests, examples and also practice Banking Exams tests.
Related Searches
Summary
,study material
,ppt
,Semester Notes
,mock tests for examination
,Radar Graphs - Banking Exams
,Previous Year Questions with Solutions
,Free
,video lectures
,practice quizzes
,shortcuts and tricks
,Important questions
,Radar Graphs - Banking Exams
,Objective type Questions
,Sample Paper
,Radar Graphs - Banking Exams
,past year papers
,MCQs
,Viva Questions
,Exam
,Extra Questions
;


Additional Information about Radar Graphs for Banking Exams Preparation
Radar Graphs Free PDF Download
The Radar Graphs is an invaluable resource that delves deep into the core of the Banking Exams exam.
These study notes are curated by experts and cover all the essential topics and concepts, making your preparation more efficient and effective.
With the help of these notes, you can grasp complex subjects quickly, revise important points easily,
and reinforce your understanding of key concepts. The study notes are presented in a concise and easy-to-understand manner,
allowing you to optimize your learning process. Whether you're looking for best-recommended books, sample papers, study material,
or toppers' notes, this PDF has got you covered. Download the Radar Graphs now and kickstart your journey towards success in the Banking Exams exam.
Importance of Radar Graphs
The importance of Radar Graphs cannot be overstated, especially for Banking Exams aspirants.
This document holds the key to success in the Banking Exams exam.
It offers a detailed understanding of the concept, providing invaluable insights into the topic.
By knowing the concepts well in advance, students can plan their preparation effectively.
Utilize this indispensable guide for a well-rounded preparation and achieve your desired results.
Radar Graphs Notes
Radar Graphs Notes offer in-depth insights into the specific topic to help you master it with ease.
This comprehensive document covers all aspects related to Radar Graphs.
It includes detailed information about the exam syllabus, recommended books, and study materials for a well-rounded preparation.
Practice papers and question papers enable you to assess your progress effectively.
Additionally, the paper analysis provides valuable tips for tackling the exam strategically.
Access to Toppers' notes gives you an edge in understanding complex concepts.
Whether you're a beginner or aiming for advanced proficiency, Radar Graphs Notes on EduRev are your ultimate resource for success.
Radar Graphs Banking Exams Questions
The "Radar Graphs Banking Exams Questions" guide is a valuable resource for all aspiring students preparing for the
Banking Exams exam. It focuses on providing a wide range of practice questions to help students gauge
their understanding of the exam topics. These questions cover the entire syllabus, ensuring comprehensive preparation.
The guide includes previous years' question papers for students to familiarize themselves with the exam's format and difficulty level.
Additionally, it offers subject-specific question banks, allowing students to focus on weak areas and improve their performance.
Study Radar Graphs on the App
Students of Banking Exams can study Radar Graphs alongwith tests & analysis from the EduRev app,
which will help them while preparing for their exam. Apart from the Radar Graphs,
students can also utilize the EduRev App for other study materials such as previous year question papers, syllabus, important questions, etc.
The EduRev App will make your learning easier as you can access it from anywhere you want.
The content of Radar Graphs is prepared as per the latest Banking Exams syllabus.
|
© EduRev
|
Education Revolution
|


|


Signup on EduRev and stay on top of your study goals
10M+ students crushing their study goals daily