Force-Extension Graphs | Physics for Grade 10 PDF Download

Linear & Non-Linear Extension
- Hooke’s law is the linear relationship between force and extension
- This is represented by a straight line on a force-extension graph
- Materials that do not obey Hooke's law, i.e they do not return to their original shape once the force has been removed, have a non-linear relationship between force and extension
- This is represented by a curve on a force-extension graph
- Any material beyond its limit of proportionality will have a non-linear relationship between force and extension
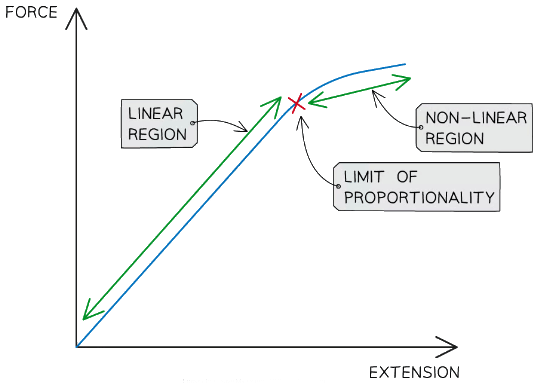 Linear and non-linear regions of a force-extension graph
Calculating Spring Constant
- The spring constant can be calculated by rearranging the Hooke's law equation for k:
k = F/e - Where:
- k = spring constant in newtons per metres (N/m)
- F = force in newtons (N)
- e = extension in metres (m)
- This equation shows that the spring constant is equal to the force per unit extension needed to extend the spring, assuming that its limit of proportionality is not reached
- The stiffer the spring, the greater the spring constant and vice versa
This means that more force is required per metre of extension compared to a less stiff spring
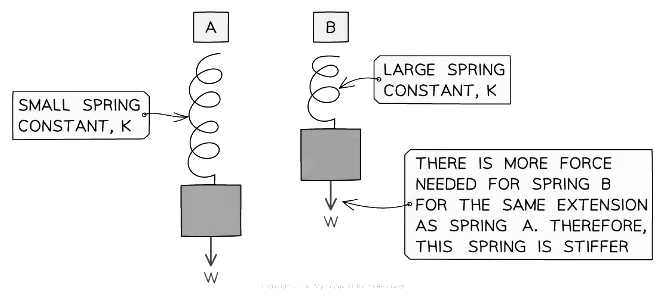 A spring with a larger spring constant needs more force per unit extension (it is stiffer)
The spring constant is also used in the equation for elastic potential energy
Tip: Remember the unit for the spring constant is Newtons per metres (N/m). This is commonly forgotten in exam questions
Example: A mass of 0.6 kg is suspended from a spring, where it extends by 2 cm. Calculate the spring constant of the spring.
Step 1: List the known quantities
Mass, m = 0.6 kg
Extension, e = 2 cmStep 2: Write down the relevant equation
k = F/eStep 3: Calculate the force
The force on the spring is the weight of the mass
g is Earth's gravitational field strength (9.8 N/kg)
W = mg = 0.6 × 9.8 = 5.88 NStep 4: Convert any units
The extension must be in metres
2 cm = 0.02 mStep 5: Substitute values into the equation
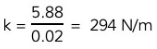
Interpreting Graphs of Force v Extension
- The relationship between force and extension is shown on a force-extension graph
- If the force-extension graph is a straight line, then the material obeys Hooke's law
- Sometimes, this may only be a small region of the graph, up to the material's limit of proportionality
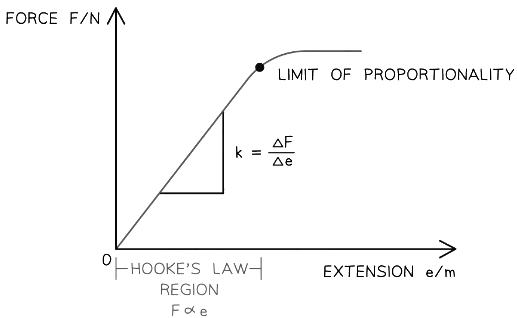 The Hooke's law region on a force-extension graph is where the graph is a straight line
- Sometimes, this may only be a small region of the graph, up to the material's limit of proportionality
- The symbol Δ means the 'change in' a variables
- For example, ΔF and Δe are the 'change in' force and extension respectively
- This is the same as rise ÷ run for calculating the gradient
- The '∝' symbol means 'proportional to'
- i.e. F ∝ e means the 'the force is proportional to the extension'
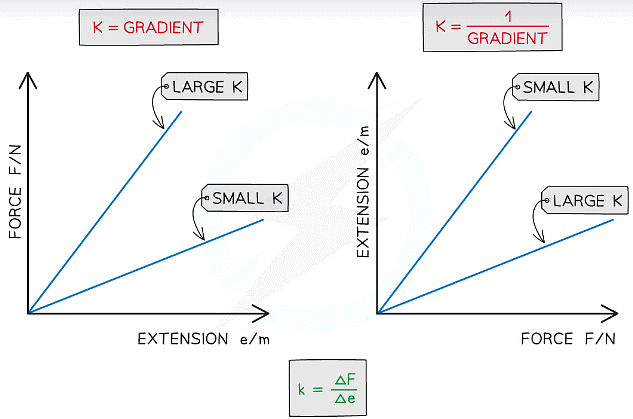 The spring constant is the gradient, or 1 ÷ gradient of a force-extension graph depending on which variable is on which axis
- i.e. F ∝ e means the 'the force is proportional to the extension'
- If the force is on the y axis and the extension on the x axis, the spring constant is the gradient of the straight line (Hooke's law) region of the graph
- If the graph has a steep straight line, this means the material has a large spring constant
- If the graph has a shallow straight line, this means the material has a small spring constant
- If the force is on the x axis and the extension on the y axis, the spring constant is 1 ÷ gradient of the straight line (Hooke's law) region of the graph
- If the graph has a steep straight line, this means the material has a small spring constant
- If the graph has a steep straight line, this means the material has a large spring constant
Tip: Make sure to always check which variables are on which axes to determine which line has a larger or smaller spring constant, as well as the units for calculations
Which of the statements is correct?
|
122 videos|150 docs|40 tests
|


Objective type Questions
,Semester Notes
,Force-Extension Graphs | Physics for Grade 10
,ppt
,Previous Year Questions with Solutions
,Force-Extension Graphs | Physics for Grade 10
,video lectures
,MCQs
,Summary
,past year papers
,Viva Questions
,shortcuts and tricks
,practice quizzes
,mock tests for examination
,Free
,Important questions
,Extra Questions
,Exam
,Sample Paper
,study material
,Force-Extension Graphs | Physics for Grade 10
;


Force-Extension Graphs Free PDF Download
Importance of Force-Extension Graphs
Force-Extension Graphs Notes
Force-Extension Graphs Grade 10 Questions
Study Force-Extension Graphs on the App
|
© EduRev
|
Education Revolution
|


|


within 7 days!