Grade 10 Exam > Grade 10 Notes > Chemistry for Grade 10 > Pure Substances
Pure Substances | Chemistry for Grade 10 PDF Download
Pure Substances
- In everyday language, we use the word pure to describe when something is natural or clean and to which nothing else has been added
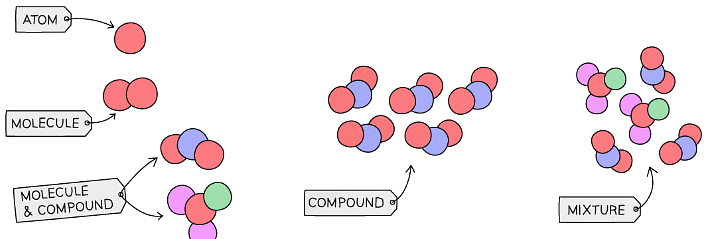
- In chemistry, a pure substance may consist of a single element or compound which contains no other substances
- For example, a beaker of a sample of pure water contains only H2O molecules and nothing else
- If salt were added to the beaker then a mixture is produced
- A mixture consists of two or more elements or compounds that are physically mixed together, they are not chemically combined
- The chemical properties of the substances in a mixture remain unchanged
- Substances in mixtures can be separated by physical means
- Air for example is a mixture of nitrogen, oxygen and some other gases such as carbon dioxide and argon
 Diagram showing how to represent elements, compounds and mixtures using particle diagrams
Distinguishing Purity
- Pure substances melt and boil at specific and sharp temperatures e.g. pure water has a boiling point of 100°C and a melting point of 0°C
- Mixtures have a range of melting and boiling points as they consist of different substances that tend to lower the melting point and broaden the melting point range
- Melting and boiling points data can therefore be used to distinguish pure substances from mixtures
- Melting point analysis is routinely used to assess the purity of drugs
- This is done using a melting point apparatus which allows you to slowly heat up a small amount of the sample, making it easier to observe the exact melting point
- This is then compared to data tables
- The closer the measured value is to the actual melting or boiling point then the purer the sample is
Cooling Curves
- The influence of impurities can be more clearly seen on a heating / cooling curve
- If the temperature of a liquid is measured as it cools and freezes the data can be used to produce a graph
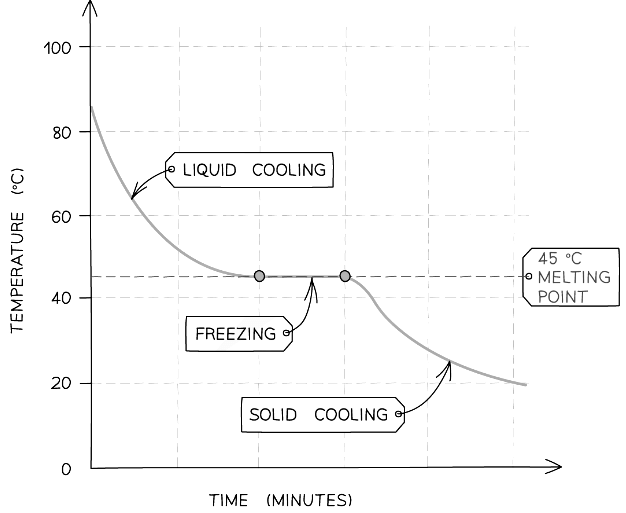
- The following graph shows the cooling curve for a sample of a compound
- The horizontal part of the graph shows that the compound has a sharp melting point, so the compound is pure
 Cooling curve for a pure substance
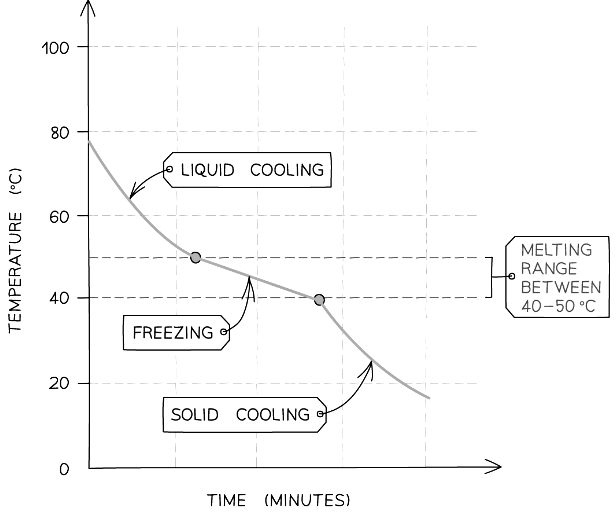
- An impure sample of the compound would produce a gradual decrease in temperature as it freezes, as shown in the graph below
 Cooling curve for an impure substance
The document Pure Substances | Chemistry for Grade 10 is a part of the Grade 10 Course Chemistry for Grade 10.
All you need of Grade 10 at this link: Grade 10
|
75 videos|131 docs|24 tests
|
Related Searches


