Motion and Time Class 7 Notes Science Chapter 9
| Table of contents |
|
| Importance of measuring time in human history |
|
| Slow and Fast Motion |
|
| Average Speed |
|
| Distance and Time Graphs |
|
| Key Word |
|
| Activity 1: |
|
| Activity 2: |
|
| Activity 3: |
|
| Activity 4: |
|
Importance of measuring time in human history
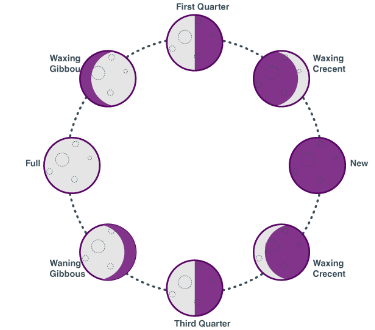
How people in ancient times measured time using the movement of celestial bodies.
Measuring Time in Ancient Civilizations.
How people in ancient civilizations measured time using repeated events such as sunrise and full moons. Why people felt the need to split the day into smaller periods as civilizations grew.
Measuring Time Today
Importance of measuring time in modern times for scheduling and other purposes. Examples of how time is measured today such as heart rate, transportation schedules, and computer operations.
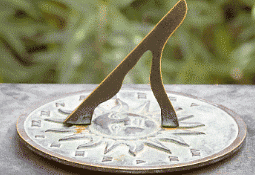
The World's Largest Sundial
Location of the world's largest sundial, the Virhat Samrat Yantra in Jantar Mantar, Jaipur. How the sundial is accurate to a few seconds.
Defining Time
How time is defined as the period between two events. Examples of two events that can be used to define time, such as sunrise and sunset.
Instruments used to measure time

Question for Chapter Notes: Time & MotionTry yourself:What is the principle behind the measurement of time using a simple pendulum?
View Solution
Sundials: a rod stuck upright in the ground, whose shadow changed direction with the movement of the sun across the sky
Hourglass: two rounded glass bulbs connected by a narrow neck of glass, filled with sand to measure time
Water clock: worked on the principle of regulated flow of water
Pendulum clock: invented by Christiaan Huygens in 1656, consisted of weights and a swinging pendulum
Atomic clock: very accurate
Units of time
The SI unit of time is the second. Large time scales are measured in units such as petaseconds. Small time scales are measured in units such as picoseconds.
Scientist Profile: Christiaan Huygens
Born in 1629 in the Netherlands. Made important contributions in the fields of astronomy and light. Invented the pendulum clock
Measurement of time using periodic motion
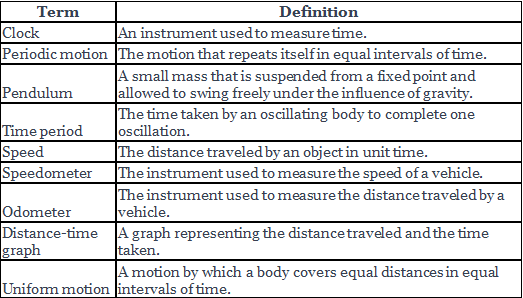
Any object that is moving is in motion. Periodic motion repeats itself in equal intervals and is used to measure time. Examples of periodic motion include the rotation and revolution of celestial bodies and the oscillation of a pendulum.
Simple pendulum
A setup that contains a small mass suspended from a fixed point and allowed to swing freely under the influence of gravity is called a pendulum. An ideal, simple pendulum consists of a small mass (like a stone or a metal ball) called a bob suspended by a string. The time taken to complete one oscillation is called the time period of the pendulum. The time period of a pendulum depends on the length of the string or wire used. The length of the pendulum is fixed, so its time period is constant.
Slow and Fast Motion
Objects can travel at different speeds, such as an airplane moving fast and a bicycle moving slow. The terms 'fast' and 'slow' refer to the speed of an object. Speed is defined as the distance traveled by an object in unit time. The SI unit of speed is meter per second (m/s). Faster objects cover more distance in a given unit of time compared to slower objects.
Calculation of Speed
Speed can be calculated if the distance traveled and the time taken are known.
Speed = Distance traveled / Time taken
Example:
Shreya, Ronald, Sabina, and Kirit participated in a race, taking 20s, 22s, 25s, and 28s, respectively, to reach the finishing line. We need to determine the fastest and slowest runners.
Shreya's speed: Distance traveled / Time taken = 100m / 20s = 5m/s
Calculate the speeds of Ronald, Sabina, and Kirit similarly.
The person who takes the shortest time to cover the same distance runs the fastest.
Example 1: A school bus covers a distance of 7200m in 1800s. We need to calculate its speed.
Given:
Distance traveled by the bus = 7200m
Time taken = 1800s
Speed = Distance traveled / Time taken
Speed = 7200m / 1800s = 4m/s
Average Speed
In practice, many objects do not travel at a constant speed.
Average speed is calculated as the total distance traveled divided by the total time taken.
Average Speed = Total Distance traveled / Total Time taken.
Speed Detection Cameras
Speeding vehicles can cause serious injuries and even death to passengers and pedestrians. Traffic police in India have installed 'Speed Detection Cameras' on major roads and junctions to discourage speeding and reduce accidents. The cameras help in penalizing and punishing drivers for speeding, ensuring safe driving.
Different Units of Speed
Depending on the need and context, speed is measured in different units such as meters per second (m/s), kilometers per hour (km/h), and miles per hour. The appropriate unit of speed depends on what is being measured, for example, the speed of cars and planes is usually measured in km/h.
Measuring Speed
A speedometer is an instrument used to measure the speed of a vehicle, usually fitted on the dashboard of a car or on the handlebar of a scooter or motorcycle. The distance traveled by the vehicle is given by an odometer, usually fitted together with the speedometer.
Importance of Safe Driving
Speeding on the road can lead to accidents and should be avoided. Drivers should adhere to the safe speed limits appropriate for the road to ensure the safety of all passengers and other road users. Special care must be taken to drive slowly close to schools, on winding roads, and when visibility is poor.
Expressing Speed in km/h:
Speed can be expressed in different units, and it is often appropriate to use km/h for measuring the speed of cars and other vehicles.
The speed of a school bus in meters per second (m/s) can be converted to km/h by dividing the distance traveled by the time taken.
The speeds of different moving things can be arranged in ascending order of their speeds in a notebook after converting them to the same unit of measurement.
Distance and Time Graphs
A vehicle traveling on a road does not travel at a constant speed throughout its journey. To understand its speed at different points in time, we can note the distance traveled by the object at equal intervals of time. The data of distance traveled and time taken can be presented in a table or a graph. A distance-time graph is created by plotting a series of data points and connecting them to form a line. The x-axis represents time, and the y-axis represents distance.
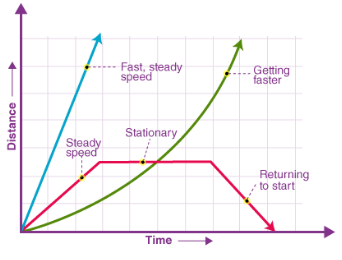
Examining the distance-time graph provides the following insights:
The steepness of the slope of the graph indicates the speed. A steeper slope represents a greater speed. A flat graph parallel to the 'time' axis indicates zero speed.
Uniform Motion
If a vehicle moves at a constant speed, covering the same distance in equal intervals of time, it is said to be in uniform motion. Uniform motion is represented by a steadily rising straight line on a distance-time graph. Non-uniform motion refers to a situation where the object does not cover equal distances in equal intervals of time.
Analyzing Motion
Motion can be analyzed in different ways. Pie charts can be used to determine the fraction or percentage of time spent at different speeds. Bar graphs can represent the distance traveled by an object at different speeds.
Reference Point and Numeric Value
When locating an object, a reference point is used, often the origin (zero point) of an axis (x or y). Numeric values for an object's location are given as positive (+) or negative (-) in relation to the reference point. The starting point is typically taken as the origin (x = 0).
 |
Download the notes
Chapter Notes: Time & Motion
|
Download as PDF |
Key Word
Activity 1:
Aim: To show the constancy of the time period of a pendulum
Materials needed: A string, a small stone, a doorknob/handle, and a stopwatch
Method: Tie the stone to one end of a string and tie the other end of the string to a doorknob/handle. Displace the stone slightly and let it oscillate freely. Use a stopwatch to note the time taken by the stone to complete ten oscillations. Divide the time taken for ten oscillations by 10 to find the time period of the pendulum. Repeat the experiment many times without changing the arrangement.
Observation: The time period is the same in each case.
Conclusion: This shows the constancy of the time period of the pendulum.
Activity 2:
Aim: To study fast and slow-moving objects
Materials needed: Wind-up/battery-operated toys, stopwatch, long smooth surface, measuring tape, chalk piece
Method: Mark a starting line and a finishing line with a chalk piece.
Measure a convenient length (e.g., 5m or 10m) using a measuring tape and mark the finishing line.
Each participant places a toy on the starting line.
Wind up or start the toy and use the stopwatch to measure the time it takes to reach the finishing line.
Record the measurements in a tabular form.
Examine the results and identify the fastest and slowest toys.
Conclusion: The fastest toy covers the same distance in a shorter period of time.
 |
Take a Practice Test
Test yourself on topics from Class 7 exam
|
Practice Now |
Activity 3:
To calculate speed
Aim: To calculate the speed of a vehicle.
Materials needed: Stopwatch or wristwatch with a second hand, a notebook.
Method involves selecting a straight road that is not too crowded to go on a drive.
Note starting and finishing time, distance, and repeat the process for five or six runs.
Calculate the speed for each run and fill in the last column of the table.
Activity 4:
Plotting Distance vs. Time Graphs for Uniform Motion
Aim: To plot the distance vs. time graphs for uniform motion.
Materials needed:
Graph paper
Pencil
Method:
Take the speed of the body as 10 m/s.
Calculate the distance traveled by the body at the end of 1, 2, 3, etc. seconds.
Use the x-axis for time and the y-axis for distance traveled.
Plot the distance vs. time graph on a centimeter graph sheet, where 1 cm = 1 s.
Repeat steps 2-4 for speeds of 50 m/s and 5 m/s on the same graph sheet.
Observe the graphs obtained for different speeds.
Observation: A straight line graph is obtained.
Conclusion: The body is in uniform motion.
|
140 videos|108 docs|18 tests
|


study material
,Important questions
,Objective type Questions
,Motion and Time Class 7 Notes Science Chapter 9
,Previous Year Questions with Solutions
,practice quizzes
,Motion and Time Class 7 Notes Science Chapter 9
,Free
,Semester Notes
,Summary
,shortcuts and tricks
,Motion and Time Class 7 Notes Science Chapter 9
,Viva Questions
,past year papers
,Exam
,Sample Paper
,MCQs
,video lectures
,mock tests for examination
,Extra Questions
,ppt
;


Chapter Notes: Time & Motion Free PDF Download
Importance of Chapter Notes: Time & Motion
Chapter Notes: Time & Motion
Chapter Notes: Time & Motion Class 7 Questions
Study Chapter Notes: Time & Motion on the App
|
© EduRev
|
Education Revolution
|


|


