One Variable Data Table | How to become an Expert of MS Excel - Class 6 PDF Download
| Table of contents |

|
| Introduction |

|
| What is a One Variable Data Table? |

|
| How to Create a One Variable Data Table |

|
| Example: Loan Repayment Analysis |

|
| Sample Problems |

|
Introduction
In this article, we will introduce you to the powerful tool called "One Variable Data Table." Whether you're a beginner or an intermediate user, this feature will simplify your data analysis tasks and help you make informed decisions.
What is a One Variable Data Table?
A One Variable Data Table is a feature in Microsoft Excel that allows you to perform sensitivity analysis by calculating multiple results based on different input values. It's particularly useful when you want to analyze the impact of changing a single variable in a formula or function.
With a One Variable Data Table, you can quickly compare the outcomes for various input values without having to manually enter and calculate each one. It saves time, enhances productivity, and provides valuable insights into your data.
How to Create a One Variable Data Table
To create a One Variable Data Table, follow these simple steps:
- Set up your worksheet: Start by organizing your data in an Excel worksheet. Typically, you will have a column for the input values and a cell where you want to display the results.
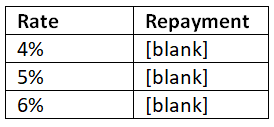
- Define the input values: In a blank column, enter the different values you want to test. For example, let's consider a scenario where you want to analyze the impact of different interest rates on a loan repayment. In column A, enter the interest rates (e.g., 4%, 5%, 6%).
- Set up the formula: In a separate cell, enter the formula or function that calculates the desired result. In our example, let's assume the loan repayment is calculated using the formula =PMT(interest rate, number of periods, loan amount). Place this formula in cell B2.
- Create the One Variable Data Table: Select the range of cells that includes both the input values and the formula. In our example, you would select cells A1:B3.
- Open the Data Table dialog: Go to the "Data" tab in Excel's ribbon, and click on "What-If Analysis" in the "Data Tools" group. From the dropdown menu, select "Data Table."
- Specify the input cell reference: In the Data Table dialog, enter the cell reference of the input cell that contains the formula. In our example, this would be cell B2.
- Select the row or column input cell: Enter the reference of the input cell containing the values you want to test. In our example, this would be cell A2.
- Click "OK": After specifying the input cell references, click "OK" in the Data Table dialog. Excel will automatically calculate the results for each input value and populate the table.
Example: Loan Repayment Analysis
Let's walk through an example to demonstrate how the One Variable Data Table works.
Consider a loan with a principal amount of $10,000 and a loan duration of 5 years. We want to analyze the impact of different interest rates on the monthly repayment amount.
- Set up your worksheet as shown below:


- In cell B2, enter the formula '=PMT(A2/12, 5*12, 10000)' to calculate the monthly repayment amount based on the interest rate.
- Select the range A1:B4 (including the headers and all interest rate values).
- Open the Data Table dialog, specify the input cell reference as B2, and select A2 as the row input cell.
- Click "OK."
After following these steps, Excel will populate the table with the calculated monthly repayment amounts for each interest rate. You can now easily compare the results and analyze the impact of changing interest rates on the loan repayment.
Sample Problems
Problem 1: You are a sales manager analyzing the impact of different discount percentages on the sales revenue. The original sales revenue is $50,000, and you want to test discount percentages ranging from 5% to 25% in increments of 5%. Calculate and compare the resulting sales revenue for each discount percentage.
Follow the steps outlined earlier to set up your data table. Use the formula '=Revenue - (Discount Percentage * Revenue)' to calculate the resulting sales revenue. Specify the discount percentages in column A and the formula in column B. The One Variable Data Table will populate the sales revenue values for each discount percentage.
Problem 2: You are a project manager estimating the project completion time based on different resource allocation scenarios. The original estimated completion time is 12 weeks, and you want to analyze the impact of allocating different numbers of resources ranging from 2 to 6. Calculate and compare the resulting completion time for each resource allocation scenario.
Set up your data table with the resource allocation values in column A and the formula '=Estimated Completion Time / Resource Allocation' in column B. Specify the original estimated completion time in cell B2. The One Variable Data Table will calculate the resulting completion time for each resource allocation scenario.
Conclusion
The One Variable Data Table is a powerful feature in Excel that simplifies data analysis and enables quick comparison of different scenarios. By following the simple steps outlined in this article, you can create your own One Variable Data Tables and gain valuable insights from your data.
Remember to organize your data, define the input values and formulas, and utilize the Data Table dialog to specify the input cell references. With this knowledge, you'll be well-equipped to perform sensitivity analysis and make informed decisions in your Excel worksheets.
|
92 videos|62 docs|15 tests
|


