Points to Remember- Introduction to Graphs (old content) - Class 8 PDF Download

Points to Remember
• Pictorial and graphical representation are easier of understand.
• Bar graphs and pie graphs are used for comparing categories and parts respectively.
• A histogram is a bar graph that shows data in intervals.
• A line graph displays data that change continuously over periods of time.
• A line graph being wholly an unbroken line is called a linear graph.
• For fixing a point the graph sheet we take two mutually perpendicular lines called axes.
• The horizontal line of the axes is called the x-axis and the vertical line is called the y-axis.
We Know That
The purpose of drawing a graph is to show numerical facts in usual form so that they can be understood quickly, easily and clearly. We also know that a bar graph is used to show a comparison among categories. A bar graph may consists of two or more parallel horizontal or vertical bars of
equal width.
A pie-graph is used to compare various parts of a whole using a circle. A histogram is a bar-graph that shows data in intervals. It has adjacent bars over the intervals as shown below.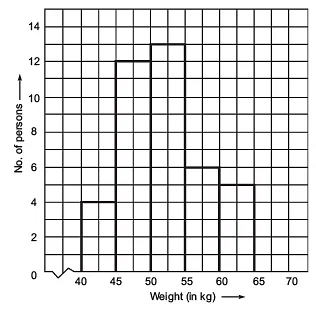
A line-graph is called a linear-graph and it displays data that changes continuously over periods of time.
Solved Example:
Q 1. From the given line graph answer the following questions
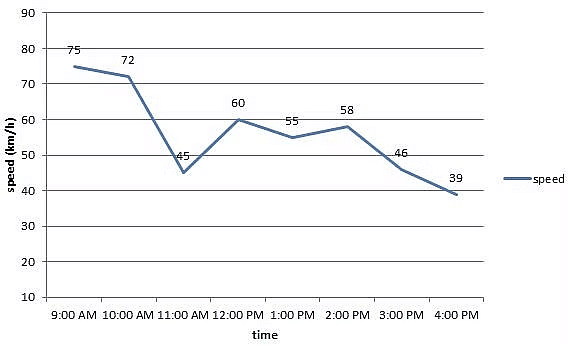
What was the speed of the car at 1:00 PM?
Find the difference in the speed of the car for the time 10 AM and 11 AM?
What are the maximum and the minimum speed of the car?
Solution: From the line graph,
The speed of the car is 55 km/h.
The difference in speed of the car = (72 − 45) km/h = 27 km/h.
The maximum speed = 75 km/h and the minimum speed = 39 km/h.
Q 2. Are the coordinates (4, 5) and (5, 4) the same? Why?
Solution: No, (4, 5) and (5, 4) are not the same. In (4, 5) the x-coordinate is 4 whereas in (5, 4) it is 5. The same is with the y-coordinate too. As a result, they are different and they represent the different sets of points.
Q 3. Draw the following points on the graph and answer the following questions.
(2, 210), (5, 420), (7, 560), (6, 490), (3, 280), (1, 140), (8, 630)
1. Is it a linear graph?
2. What is the value of x-coordinate if y-coordinate corresponds to 350?
3. If the graph is linear, find the value of y-coordinate for which x-coordinate is 11.
Solution: The graph for the above points.
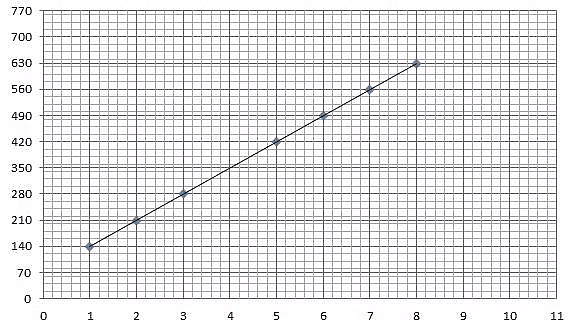
1. The graph is a linear graph.
2. The coordinates of the point will be (4, 350).
3. The value will be 840. The coordinates of the point will be (11, 840).
This concludes our discussion on how to make a chart and a linear graph.

Top Courses for Class 8

Important questions
,Sample Paper
,Viva Questions
,study material
,practice quizzes
,past year papers
,Points to Remember- Introduction to Graphs (old content) - Class 8
,shortcuts and tricks
,MCQs
,video lectures
,Semester Notes
,Objective type Questions
,Previous Year Questions with Solutions
,Free
,ppt
,Points to Remember- Introduction to Graphs (old content) - Class 8
,Extra Questions
,Points to Remember- Introduction to Graphs (old content) - Class 8
,mock tests for examination
,Exam
,Summary
;


Points to Remember- Introduction to Graphs (old content) Free PDF Download
Importance of Points to Remember- Introduction to Graphs (old content)
Points to Remember- Introduction to Graphs (old content) Notes
Points to Remember- Introduction to Graphs (old content) Class 8 Questions
Study Points to Remember- Introduction to Graphs (old content) on the App
|
© EduRev
|
Education Revolution
|


|


