Graphical Representation of Titration Curves | Chemistry for JAMB PDF Download
| Table of contents |

|
| Introduction |

|
| What is Acid-Base Titration? |

|
| Key Terms |

|
| Types of Acid-Base Titration |

|
| Titration Curve |

|
| Indicator Selection |

|
| Solved Example |

|
Introduction
Acid-base titration is a powerful quantitative analysis method used to determine the concentration of acids or bases by precisely neutralizing them with a standard solution of known concentration. This article delves into the key aspects of acid-base titration, including titration curves, the equivalence point, and the role of indicators.
What is Acid-Base Titration?
Acid-base titration is an experimental technique used to gather information about solutions containing acids or bases. It enables the determination of various compounds, both organic and inorganic, based on their acidic or basic properties. This process involves titrating an acid with a base or vice versa, with the endpoint usually detected using an indicator.
Acid-base titration involves the use of strong or weak acids and bases. It can be employed to determine the concentration of an acid or base, identify whether an unknown acid or base is strong or weak, and calculate the pKa of an unknown acid or pKb of the unknown base. The reaction typically proceeds through proton transfer, where the proton is solvated as H3O+ in water. Acid-base reactions are reversible, with the acid reacting with a base to form a conjugate base and a conjugate acid.
Key Terms
- Titration: A process where a solution of known strength is added to a treated sample containing an indicator.
- Titrant: A solution of known concentration used in the titration.
- Titrand: The solution to which the titrant is added, containing the ion or species being determined.
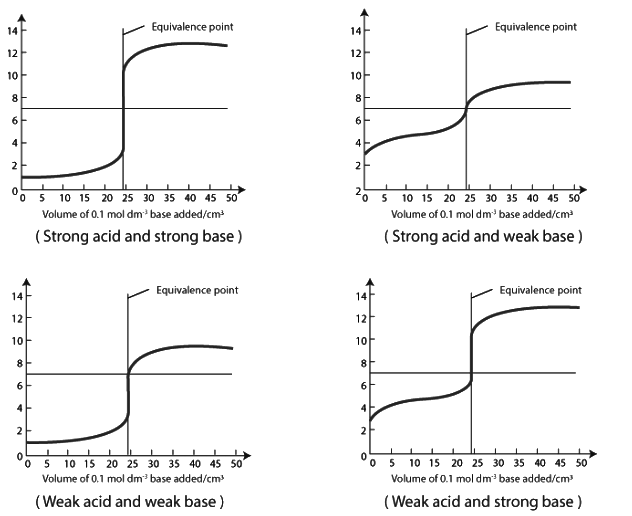
- Titration curve: A plot of pH versus milliliters of titrant, showcasing the pH changes during an acid-base titration.
- Equivalence point: The point at which just enough reagent has been added to completely react with a substance.
- Buffer solution: A solution that maintains a stable pH even when a strong acid or base is added or when it is diluted with water.
Types of Acid-Base Titration
There are four main types of acid-base titrations:
- Strong acid-strong base (e.g., hydrochloric acid and sodium hydroxide)
- Weak acid-strong base (e.g., ethanoic acid and sodium hydroxide)
- Strong acid-weak base (e.g., hydrochloric acid and ammonia)
- Weak acid-weak base (e.g., ethanoic acid and ammonia)
Titration Curve
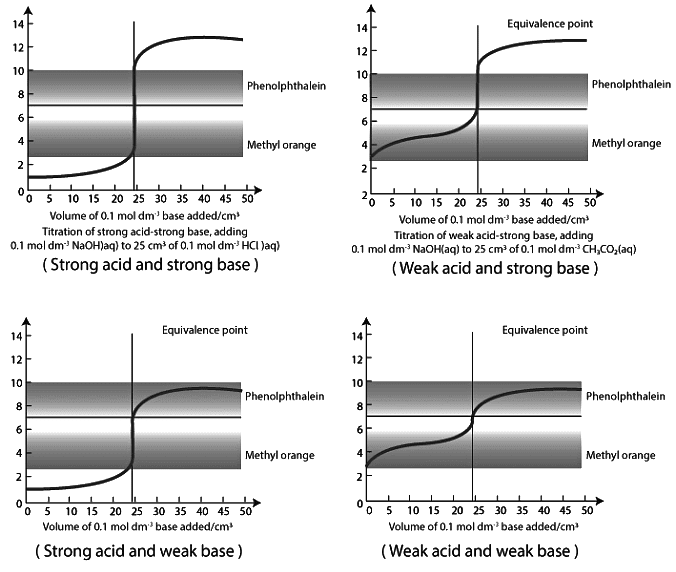
In acid-base titration, the titration curve represents the pH change as the titrant is added. Each type of titration curve exhibits distinct characteristics. The curve includes horizontal sections, where the pH remains relatively stable even with the addition of more base. However, in the case of weak acids and bases, a single drop of base can cause a significant pH change. The equivalence point, although not always centered at pH 7, results in a noticeable pH shift.

Indicator Selection
Acid-base indicators play a crucial role in titrations, as they change color or develop turbidity at specific pH values. Indicators must be soluble, stable, exhibit strong color changes, and be organic in nature. They can be classified into three groups: phthaleins and sulphophthaleins (e.g., Phenolphthalein), azo indicators (e.g., Methyl orange), and triphenylmethane indicators (e.g., Malachite green). The choice of indicator depends on the type of titration being conducted and the pH range in which the indicator undergoes a noticeable color change.
Solved Example
Problem: A 1.2g sample of a mixture of (Na2CO3 + NaHCO3) is dissolved and titrated with 0.5N HCl. The endpoint is reached at 15 mL when using phenolphthalein, and a second endpoint is observed at 22 mL after further addition of methyl orange. Calculate the percentage composition of the mixture.
Sol:
The composition of Na2CO3 can be calculated as follows:
- 30 mL of acid is required to neutralize Na2CO3 completely.
- Total volume needed is 37 mL (15 mL + 22 mL).
- Thus, 7 mL of acid is needed to neutralize NaHCO3.
- Na2CO3 composition (%) = [(30 × 0.5 × 0.053) / 1.2] × 100 = 66.25%
- NaHCO3 composition (%) = [(7 × 0.5 × 0.042) / 1.2] × 100 = 24.50%
|
213 videos|209 docs|162 tests
|


