Line Charts | Know Your Aptitude Class 6 To 8 - Class 8 PDF Download
Line Chart
The line chart is nothing but an upgraded version of a bar chart. It is formed by connecting the uppermost point of the bars so that we have a line. By repeating this following process, with other bars as well we will get a line chart. The calculations can be tough but the main aim of the examiner is to check whether you can apply logic to eliminate options and evaluate the graph thereby getting the answer.
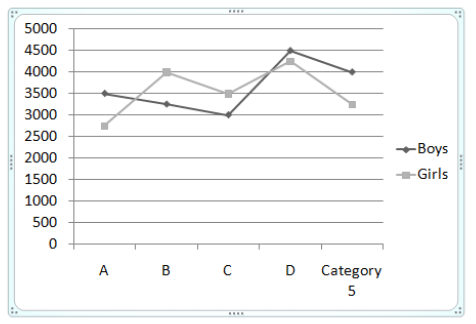
On the basis of the figure below answer the following question. In the graph, the number of boys and girls are given in five schools. Study this graph properly and answer the questions.
Q. What percentage will be the number of girls in school A out of the total number of girls in all the schools?
(a) 15
(b) 17
(c) 22
(d) 24
To solve this question there are several different approaches. Let’s look into each approach one by one.
First method
For the first method, we can calculate the number of girls simply by adding all the girls in the schools and then taking the girls from school A as the numerator thereby calculating the total percentage of girls. For example, in this question, the total number of girls is 17750 and the girls in school A as a part of all the girls in all the schools will be (2750/17750) x 100 = 15.4%
The major roadblock in this method is that it requires a lot of calculation and there are chances that you may calculate in exam properly which might lead to silly mistakes. And that is why we have given a second approach to this question.
Second method
This method is based on the estimation. In this method, you have to suppose a baseline and then from the given options, you have to assume which is the closest to the answer. Suppose, there are 5 schools and every school has an equal number of 10 girls so the average will 10 and the percentage will 20%. Same will be the case for 100 girls with 5 schools. Here the percentage will be dependent on the number of schools.
In the above question also assume a baseline at the centre of the figure. As there are five schools given in the question the percentage will be 20% but the base-line is above the number of girls in A. So we can say that the number of girls in school A will be less than 20%. Thus options 3 and 4 can be negated. Now for the remaining options when we look at E and compare it with A, there is the larger difference and so 17% cannot be answered as well. Thus the remaining option is 15 which is the correct answer.
This method should only be done when the options are not very close. Thus the correct answer is (a).
|
5 videos|60 docs|13 tests
|


