Worksheet: Line Charts | Know Your Aptitude Class 6 To 8 - Class 8 PDF Download

Q1: George works as a salesman in an authorized car showroom. He records the number of cars sold in five days (Monday to Friday) on a line graph. Study the graph and answer the questions.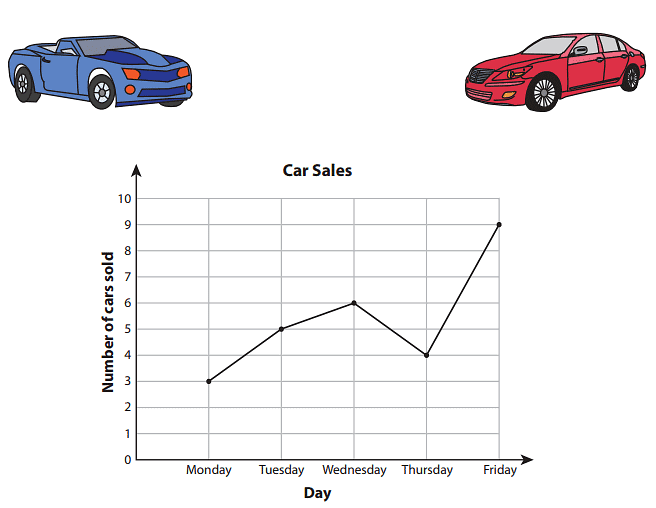
(i) How many cars were sold in 5 days?
(ii) On which day were the maximum number of cars sold?
(iii) How many cars were sold on Wednesday?
(iv) Which day had the minimum sales of cars?
(v) How many more cars were sold on Tuesday than on Monday?
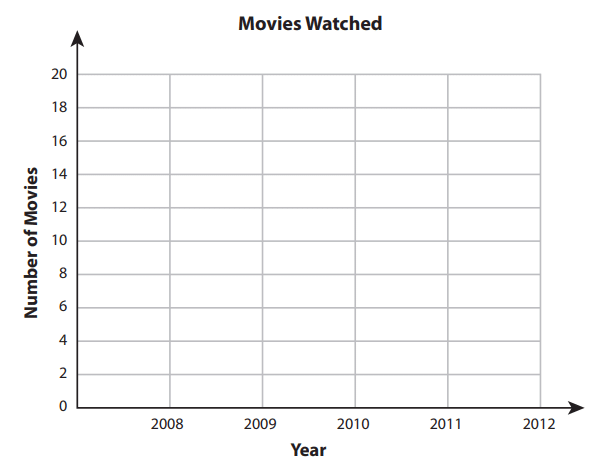
Q2: Kim and his family often watch movies at home. The data shows the number of movies watched by them from 2008 to 2012. Draw a line graph to represent the data.
Q3: A wildlife biologist made a study on the population growth of hippopotamus and recorded the information on a graph. Answer the questions based on the graph.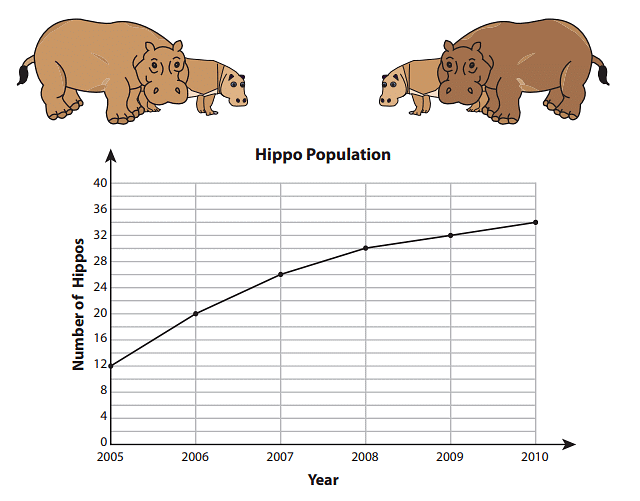 (i) In 2010, what was the population of hippopotamus?
(ii) How many hippos were there in 2007?
(iii) In which year did the hippo population reach 30 in number?
(iv) Which year recorded the minimum hippo population?
(v) How many more hippos were recorded in the year 2008 than in 2006?
You can access the solutions to this worksheet here.
|
5 videos|60 docs|13 tests
|
FAQs on Worksheet: Line Charts - Know Your Aptitude Class 6 To 8 - Class 8
| 1. What is a line chart and how is it used in data visualization? |  |
| 2. How can I create a line chart using Excel? | |
| 3. What are the key components of a line chart? | |
| 4. When is it appropriate to use a line chart instead of other types of charts? | |
| 5. What are common mistakes to avoid when creating a line chart? | |


Worksheet: Line Charts | Know Your Aptitude Class 6 To 8 - Class 8
,Summary
,Viva Questions
,ppt
,Worksheet: Line Charts | Know Your Aptitude Class 6 To 8 - Class 8
,shortcuts and tricks
,Important questions
,practice quizzes
,video lectures
,Free
,Extra Questions
,mock tests for examination
,Sample Paper
,Semester Notes
,Objective type Questions
,study material
,Exam
,Previous Year Questions with Solutions
,past year papers
,MCQs
,Worksheet: Line Charts | Know Your Aptitude Class 6 To 8 - Class 8
;


Worksheet: Line Charts Free PDF Download
Importance of Worksheet: Line Charts
Worksheet: Line Charts Notes
Worksheet: Line Charts Class 8 Questions
Study Worksheet: Line Charts on the App
|
© EduRev
|
Education Revolution
|


|


